

Core financial principle
Inventory turnover measures capital velocity, not just sales volume. High sales volume tied to bloated inventory levels can tie up critical store working capital just as severely as slow-moving merchandise.
What inventory turnover means in plain language
Inventory turnover represents the speed at which merchandise moves through your shop over a specific timeframe (typically a year, quarter, or month):
Velocity of stock: It measures how many times your entire average inventory stock is sold and replenished across the period.
Cash flow indicator: Higher turns mean working capital cycles rapidly through the business, freeing up money to pay suppliers, fund payroll, and invest in high-performing products.
Assortment health check: Low turns warn that capital is trapped in sluggish products, creating markdown pressure, storage congestion, and expiry risks.
The standard retail inventory turnover formula
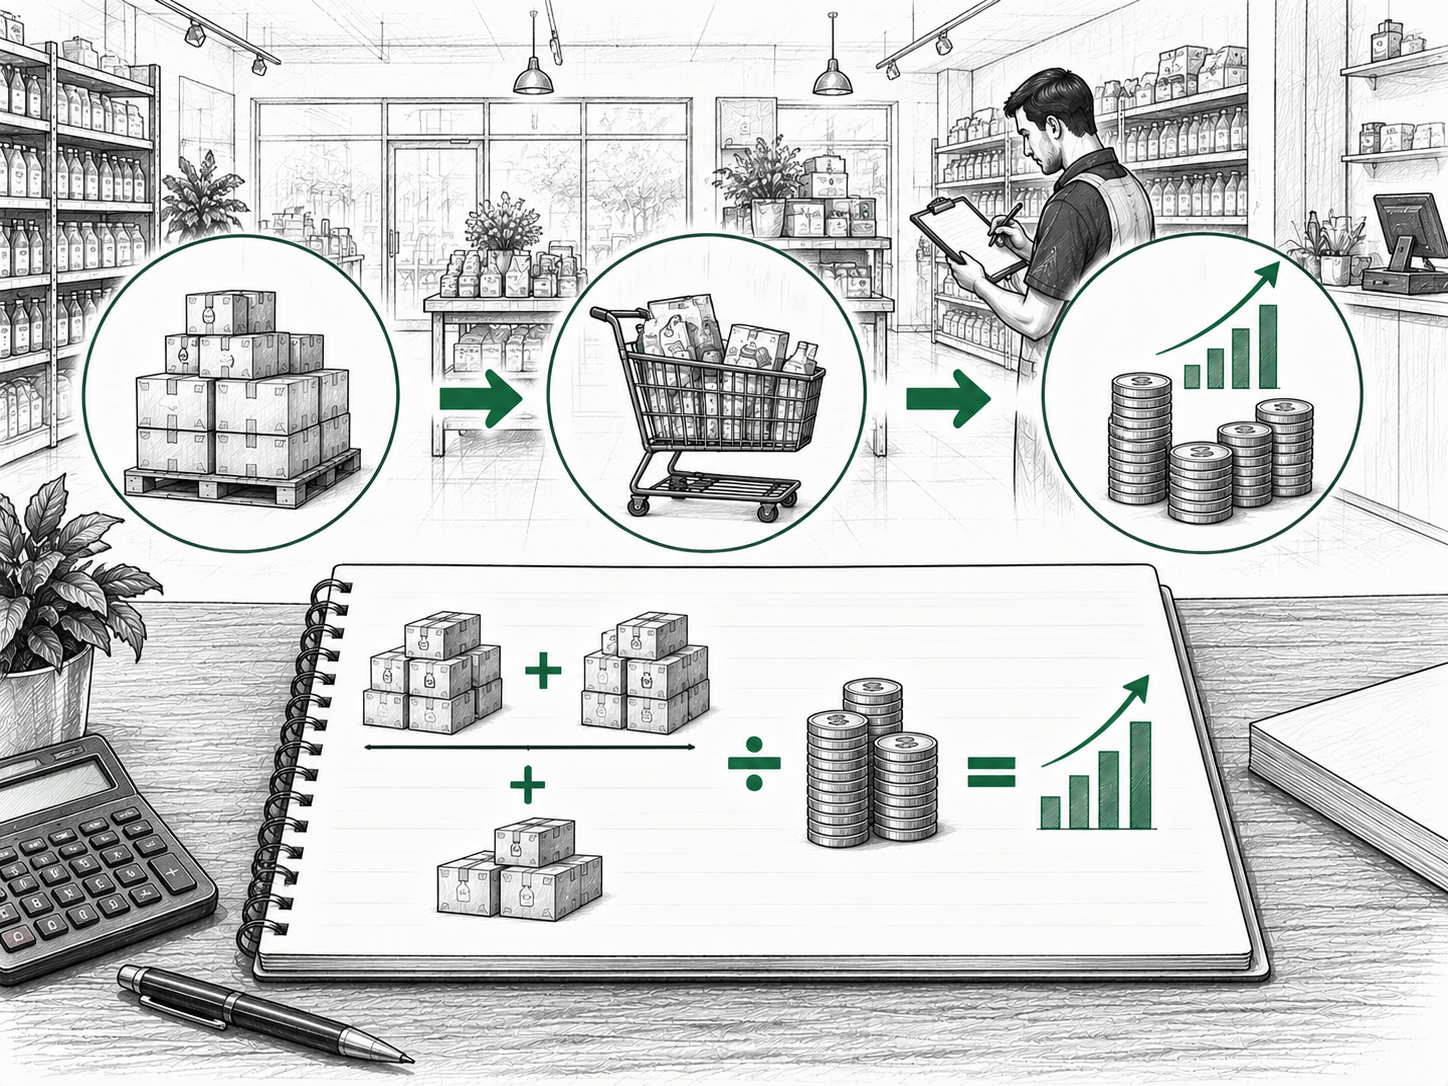
In financial accounting, inventory turnover compares the wholesale cost of merchandise sold against the average wholesale value of inventory on hand:

Accounting practices can differ depending on your reporting standards and business structure; consult your accountant or financial adviser regarding formal tax and balance sheet reporting.
Worked calculation example for a small retail store
Consider an independent neighborhood grocery store reviewing its annual performance. Here are the store's annual operating figures:
Cost of Goods Sold (COGS): Annual Cost of Goods Sold (COGS): $120,000
Beginning Inventory: Beginning Inventory at Cost (January 1): $20,000
Ending Inventory: Ending Inventory at Cost (December 31): $28,000
Average Inventory: Average Inventory at Cost: ($20,000 + $28,000) ÷ 2 = $24,000
Calculated Turnover: Calculated Inventory Turnover: $120,000 ÷ $24,000 = 5 turns per year
Interpretation: The store sold and completely replaced the value of its inventory approximately five times during the twelve-month period.
Days sales of inventory (DSI): converting turns into days
While inventory turns provide a useful macro metric, converting turnover into days makes the concept intuitive for store operators:
Important aggregate limitation: An average of 73 days does NOT mean every product in the store sells in 73 days. Fresh milk might turn every 4 days, while premium olive oil sits for 120 days. DSI is an aggregate operational benchmark.
Is high turnover always good? The operational balance
A common retail misconception is that a higher inventory turnover ratio is always better. In reality, inventory management requires balancing speed against customer availability:
Low Turnover Risks
- Risks of excessively low turnover: Cash is trapped in sluggish stock, storage space is crowded, packaging gathers dust, and perishable items risk passing their expiration dates.
- Margin erosion from low turnover: Slow-moving stock frequently requires steep markdowns or clearance discounts to liquidate, eroding overall gross margins.
Excessively High Turnover Risks
- Risks of excessively high turnover: Ordering in tiny, frantic batches can lead to frequent out-of-stock gaps on shelves, losing sales and frustrating loyal shoppers.
- Higher administrative overhead: Placing dozens of small orders increases shipping fees, delivery handling time, and invoice processing costs.
- Lost bulk purchasing terms: Ordering below supplier case minimums prevents stores from securing volume discounts or free freight thresholds.
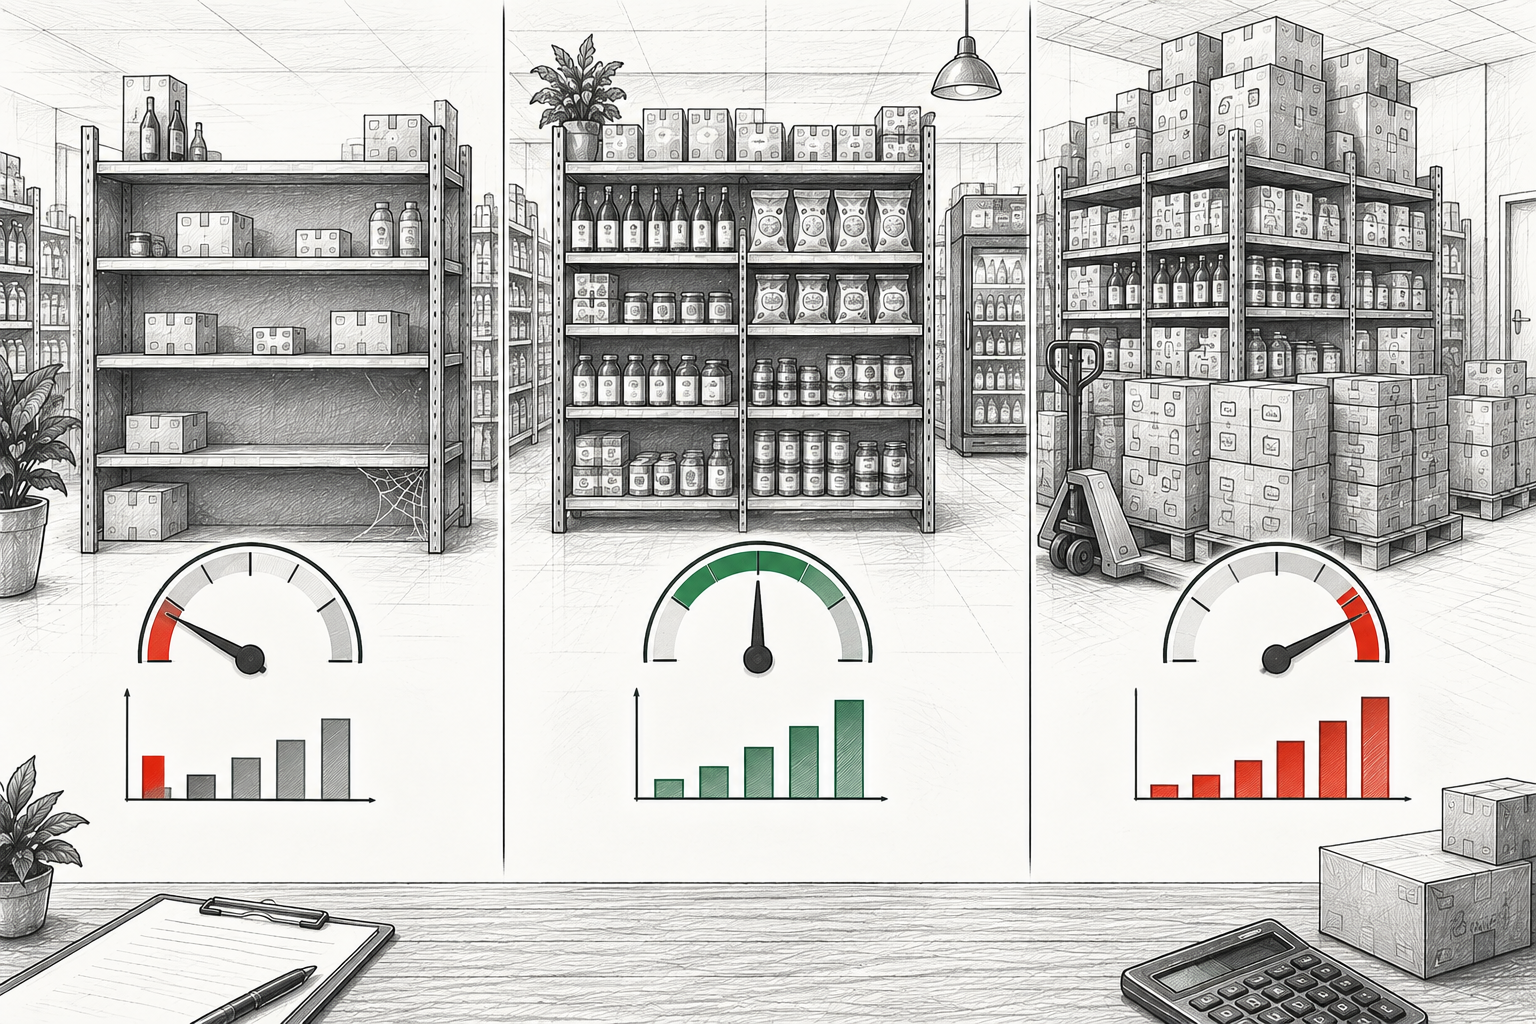
Optimal turnover strikes a balance: inventory moves swiftly enough to protect cash flow and product freshness, while maintaining sufficient safety buffer to prevent stockouts during supplier delivery delays.
What is a 'good' inventory turnover ratio for a small store?
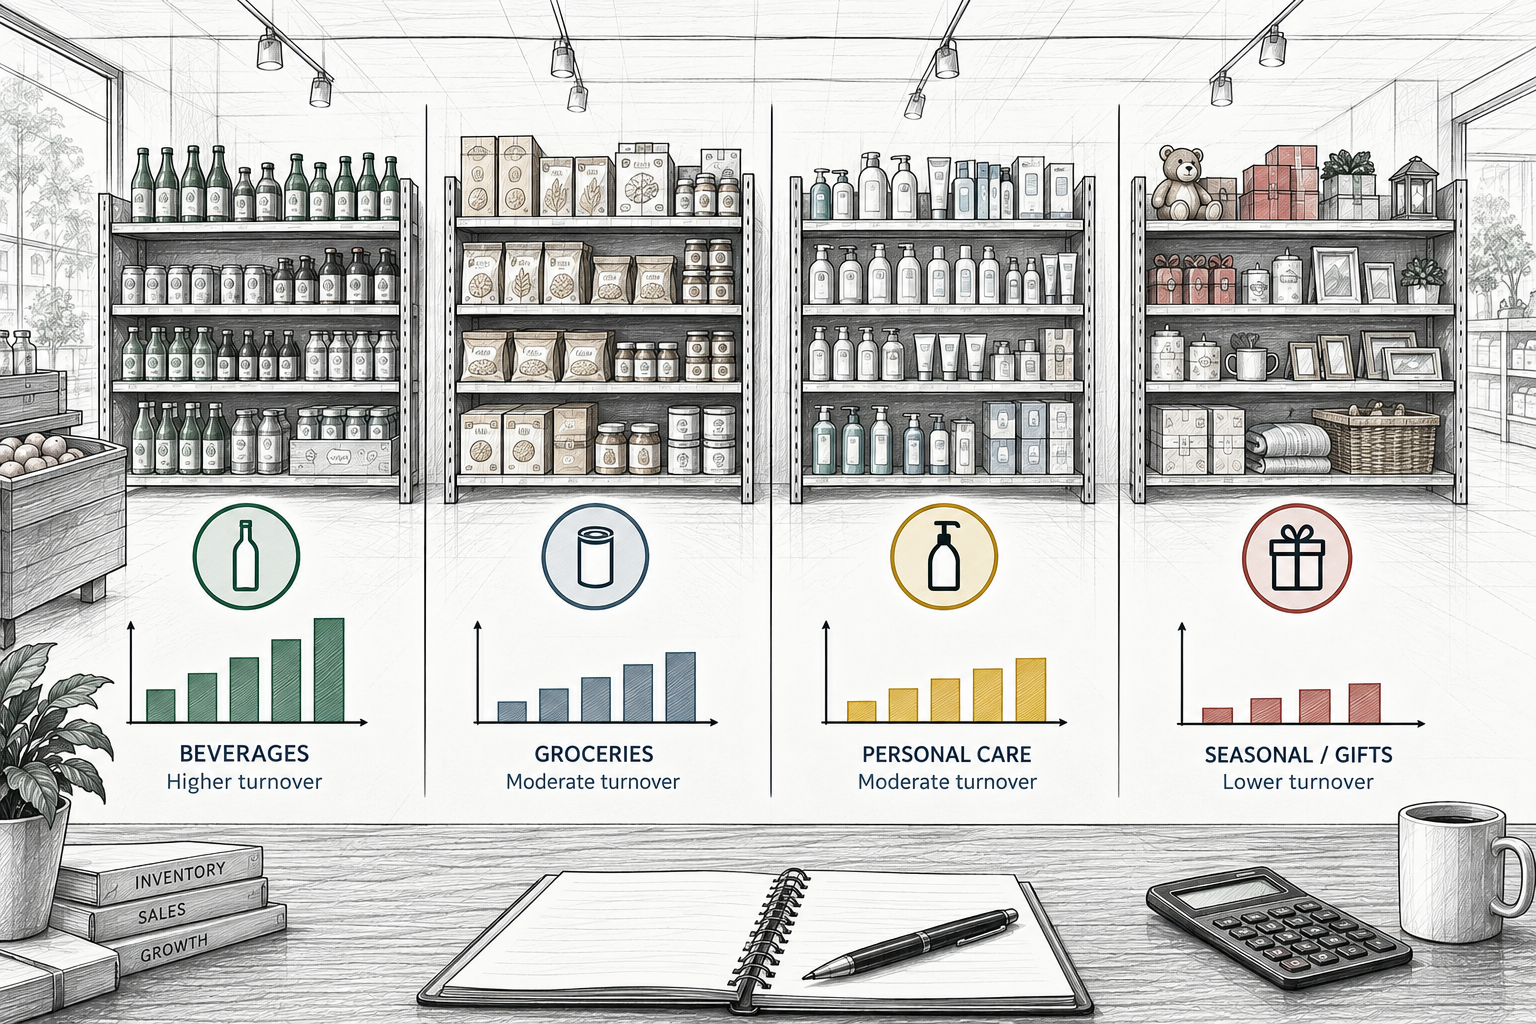
There is no single universal turnover benchmark that applies to every retail business. What constitutes an exceptional turnover ratio depends entirely on your specific retail sector and operational model:
Product perishability & shelf life:
Fresh bakeries, produce grocers, and dairy retailers often target 15 to 25+ turns annually, whereas boutique gift shops or bookstores may operate profitably at 2 to 4 turns.
Gross profit margin targets:
High-margin specialty goods (e.g. 50–60% margins on artisan gifts) can afford lower turnover, while low-margin staples (e.g. 15–20% margins on soda and snacks) require rapid velocity to pay overhead.
Supplier lead times & delivery reliability:
Stores relying on local distributors delivering three times weekly can run lean buffers, while shops sourcing imported merchandise with 6-week lead times must carry larger stock.
Seasonality & holiday demand spikes:
Holiday merchandise, summer beach gear, and winter apparel fluctuate dramatically, causing turnover rates to vary significantly across quarters.
Turnover by SKU vs category vs total store
Relying solely on a single store-wide turnover ratio can hide critical operational vulnerabilities:
Store-wide turnover (Macro):
Visibility: Provides high-level financial health for bankers, accountants, and general budgeting.
Blind spots: Masks serious category imbalances: high turnover in refrigerated beverages can hide dead seasonal merchandise lingering in the backroom.
Category-level turnover (Operational):
Visibility: Reveals how entire departments perform (e.g. craft beer vs dry pantry vs health & beauty).
Blind spots: Guides department shelf allocation and helps managers rebalance purchasing budgets across distributors.
SKU-level turnover (Tactical):
Visibility: Identifies exact winners and losers within a category (e.g. 12 oz dark roast beans vs 5 lb bulk beans).
Blind spots: Prevents over-ordering individual slow-moving flavors, scents, or sizes while keeping bestsellers in stock.
Inventory turnover vs sell-through rate
Small retailers often confuse inventory turnover with sell-through rate. While both measure sales velocity, they serve distinct analytical purposes:
Inventory Turnover Ratio:
Measures the relationship between Cost of Goods Sold and average inventory across an extended fiscal period (month, quarter, or year).
COGS ÷ Average Inventory at Cost
Evaluates overall store capital velocity, working capital health, and broad purchasing efficiency.
Sell-Through Rate:
Measures the percentage of received or available inventory units sold during a specific campaign, season, or delivery cycle.
(Units Sold ÷ Beginning Units Available) × 100
Evaluates the success of specific seasonal buys, promotional displays, or limited-run vendor shipments.
Why accurate physical stock counts are essential for turnover
The mathematical integrity of your inventory turnover calculation depends directly on the accuracy of your physical stock counts:
- Flawed physical counts produce flawed ending inventory: If unrecorded damage, theft, or miscounted shelves distort your ending inventory, average inventory will be inaccurate.
- Garbage in, garbage out: An artificial jump in recorded inventory falsely depresses your turnover ratio, making performance look worse than it is.
- Unrecorded shrink distorts cost figures: Physical stocktaking ensures book inventory matches true floor reality, providing trustworthy numbers for balance sheet calculations.
Common causes of low inventory turnover in small stores
When inventory turnover falls below healthy operational levels, the root cause typically stems from one of several common purchasing pitfalls:
Speculative over-ordering for vendor discounts:
Buying 10 cases to save 5% per unit ties up working capital for months, wiping out the initial discount in holding costs.
Excessive SKU proliferation & redundant variants:
Carrying four near-identical brands of organic tomato sauce dilutes sales across all four, slowing turns for the entire category.
Ignoring supplier minimum order quantities (MOQs):
Purchasing master case packs of slow-moving items when partial packs or jobber distributors are available.
Hesitating on price markdowns:
Holding sluggish seasonal inventory at full price rather than applying disciplined markdowns to recover capital.
Inaccurate on-hand records causing duplicate orders:
Reordering stock that already sits unworked in backroom reserve boxes because shelf counts were not verified.
How to improve inventory turnover without risking stockouts
Boosting inventory turns requires disciplined operational adjustments rather than blind inventory slashing:
Review reorder points and par levels regularly:
Adjust reorder triggers based on recent seasonal sales velocity rather than static historical assumptions.
Negotiate smaller pack sizes with distributors:
Ask sales reps for split-case options or buy through jobbers on slower SKUs to avoid buying full master cartons.
Prune underperforming, redundant SKUs:
Identify the bottom 10% of slow-turning items in each category and eliminate duplicate flavors or sizes.
Implement disciplined, timely clearance markdowns:
Liquidate seasonal leftovers and slow movers promptly to recover cash for high-velocity replenishment.
Align purchasing orders with verified physical counts:
Audit physical shelves before generating purchase orders to ensure orders reflect true floor shortages.
How Retail Scan & Stock supports inventory velocity
Retail Scan & Stock provides the essential shop floor tools needed to maintain accurate inventory records for turnover analysis:
Accurate physical counts on your phone:
Conduct quick barcode counts on your iOS or Android device to keep on-hand inventory records reliable and up to date.
Structured purchase order drafting:
Build clean purchase orders directly from shelf shortages to prevent over-ordering and avoid duplicate deliveries.
Clean spreadsheet data exports:
Export inventory valuations, stock quantities, and document histories into standard CSV or Excel files for accounting analysis.
Local-first floor reliability:
Count reserve inventory in basements and walk-in coolers without being interrupted by Wi-Fi drops or connectivity lag.
Retail Scan & Stock provides barcode-backed physical counts, purchase order drafting, and spreadsheet exports; it does not automatically calculate financial inventory turnover ratios or perform automated algorithmic demand forecasting.
Frequently Asked Questions
Why is inventory turnover calculated using Cost of Goods Sold instead of retail sales?▾
Cost of Goods Sold (COGS) reflects the actual wholesale cost paid for the merchandise that was sold. Because inventory on your balance sheet is recorded at purchase cost, dividing COGS by average inventory at cost ensures a true like-for-like comparison. Using retail sales artificially inflates the turnover ratio because sales include your profit markup.
How often should a small retail store calculate inventory turnover?▾
Most small stores review turnover on an annual or quarterly basis for financial planning and tax preparation. However, monitoring category-level velocity on a monthly basis helps identify sluggish items before they become permanent dead stock.
Can a store have an inventory turnover ratio that is too high?▾
Yes. An abnormally high turnover ratio can signal that inventory levels are dangerously lean, leading to frequent out-of-stock gaps, lost customer sales, increased delivery shipping fees, and excessive administrative ordering time.
What is the difference between inventory turnover and Days Sales of Inventory (DSI)?▾
Inventory turnover measures how many times inventory is sold and replaced over a year (e.g. 5 turns). Days Sales of Inventory converts that number into the average number of days merchandise remains in stock before selling (e.g. 365 ÷ 5 = 73 days).
How do supplier case pack sizes affect small store inventory turnover?▾
Distributors often require retailers to buy in full master cases (e.g. 12 or 24 units). If a small store sells only 2 units per month, buying a 24-unit case locks up a full year of supply, severely dragging down turnover for that SKU.
Does Retail Scan & Stock calculate inventory turnover automatically?▾
No. Retail Scan & Stock provides mobile barcode scanning, physical count sessions, and spreadsheet exports so you have accurate physical numbers to calculate turnover in your preferred spreadsheet or accounting program.
Related retail guides and tools
- → Sell-Through Rate vs Inventory Turnover: What Small Retailers Should Track
- → Reorder Point vs Par Level vs Safety Stock: Retail Guide
- → Dead Stock vs Slow-Moving Inventory: How Small Retailers Can Spot and Fix Both
- → How Often Should a Small Store Count Inventory?
- → From Stock Count to Purchase Order: Small Store Workflow