

Core metric distinction
Sell-through rate measures cohort unit clearance speed (did this specific delivery sell out?). Inventory turnover measures business-wide capital velocity (how efficiently is store working capital converting into sales?). They are complementary tools, never interchangeable substitutes.
Core differences at a glance
To manage retail merchandise effectively, independent store owners must distinguish between product cohort velocity and overall working capital velocity:
Sell-Through:
Sell-Through Rate: A unit-focused operational metric evaluating what percentage of available inventory sold during a specific promotional period, season, or delivery cycle. It answers: 'How fast did this specific batch or shipment clear out?'
Turnover:
Inventory Turnover Ratio: A financial metric comparing Cost of Goods Sold (COGS) to the average monetary value of inventory carried across an accounting period (month, quarter, or year). It answers: 'How many times did our total inventory investment convert into sales and replenish?'
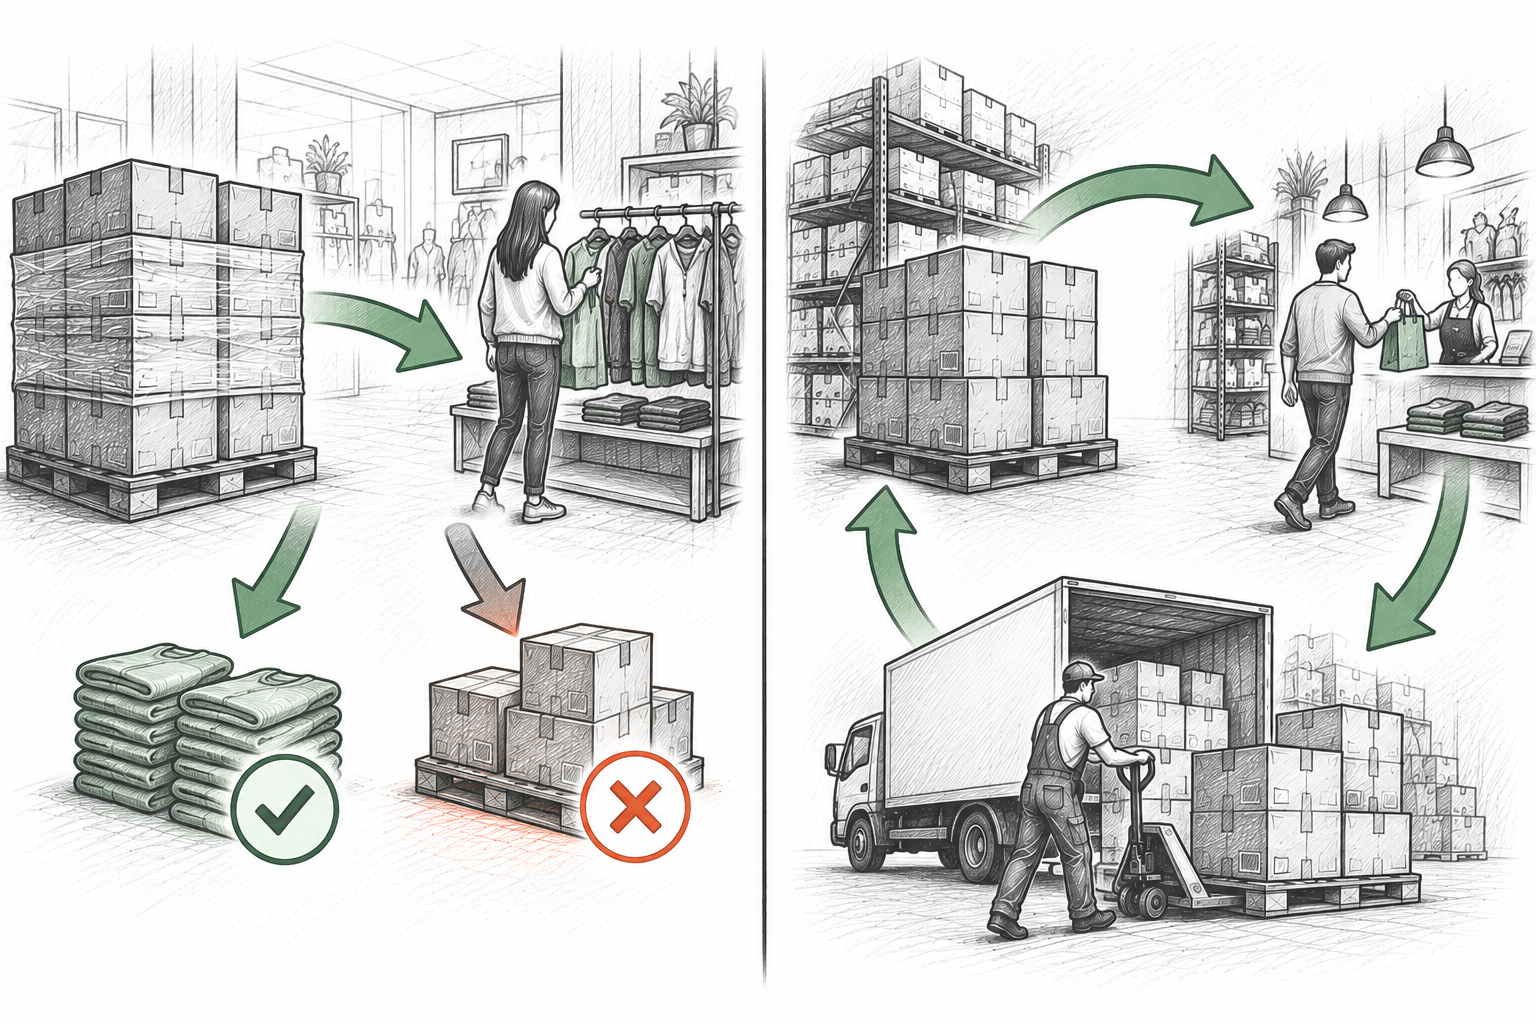
Comprehensive comparison table: sell-through vs turnover
Compare the core structural and operational differences between sell-through rate and inventory turnover ratio:
| Analytical Dimension | Sell-Through Rate | Inventory Turnover Ratio |
|---|---|---|
| Primary measurement unit | Physical units (pieces, packs, cases, items). | Monetary cost valuation (Cost of Goods Sold & Inventory at Cost). |
| Timeframe focus | Short to medium term: weekly, monthly, promotional window, or full seasonal run. | Medium to long term: rolling quarterly, semi-annual, or annual accounting cycles. |
| Scope of analysis | Specific SKU, seasonal cohort, supplier delivery batch, or promotional campaign. | Department, broad merchandise category, or aggregate store-wide inventory. |
| Key operational question | Did customers purchase this specific intake before markdown deadlines arrived? | Is the store carrying too much or too little capital tied up on display shelves? |
| Impact of stock replenishment | Continuous replenishment dilutes the cohort denominator unless carefully tracked by receipt batch. | Designed specifically for ongoing cycles of depletion, reordering, and replenishment. |
| Typical retail interventions | Immediate visual re-merchandising, bundle promotions, clearance discounting, or vendor reorders. | Adjusting safety stock, resetting par levels, negotiating lower supplier MOQs, or pruning catalog lines. |
How to calculate sell-through rate (with worked retail example)
Sell-through rate assesses how efficiently inventory converts into customer purchases over an established tracking interval:
Defining the denominator consistently: In retail operations, 'Units Available for Sale' is commonly defined as Beginning Inventory + New Deliveries Received during that window, or as a fixed intake cohort for seasonal goods. Retail systems and POS software can configure this denominator differently; the paramount operational rule is maintaining methodological consistency across all reporting periods.
Available Stock (Received): Initial intake & available stock: A small apparel boutique receives a seasonal shipment of 80 units of linen shirts and already had 20 units on display (Total Available = 100 units).
Units Sold: Sales volume: Over the first 30 days of the summer season, POS transactions record 65 units sold.
Calculation: Mathematical calculation: (65 units sold ÷ 100 units available) × 100
Result: Result: 65.0% 30-day sell-through rate.
Operational interpretation: The merchant cleared nearly two-thirds of the inventory at full price in the first month, confirming strong initial pricing, prime floor placement, and healthy consumer demand.
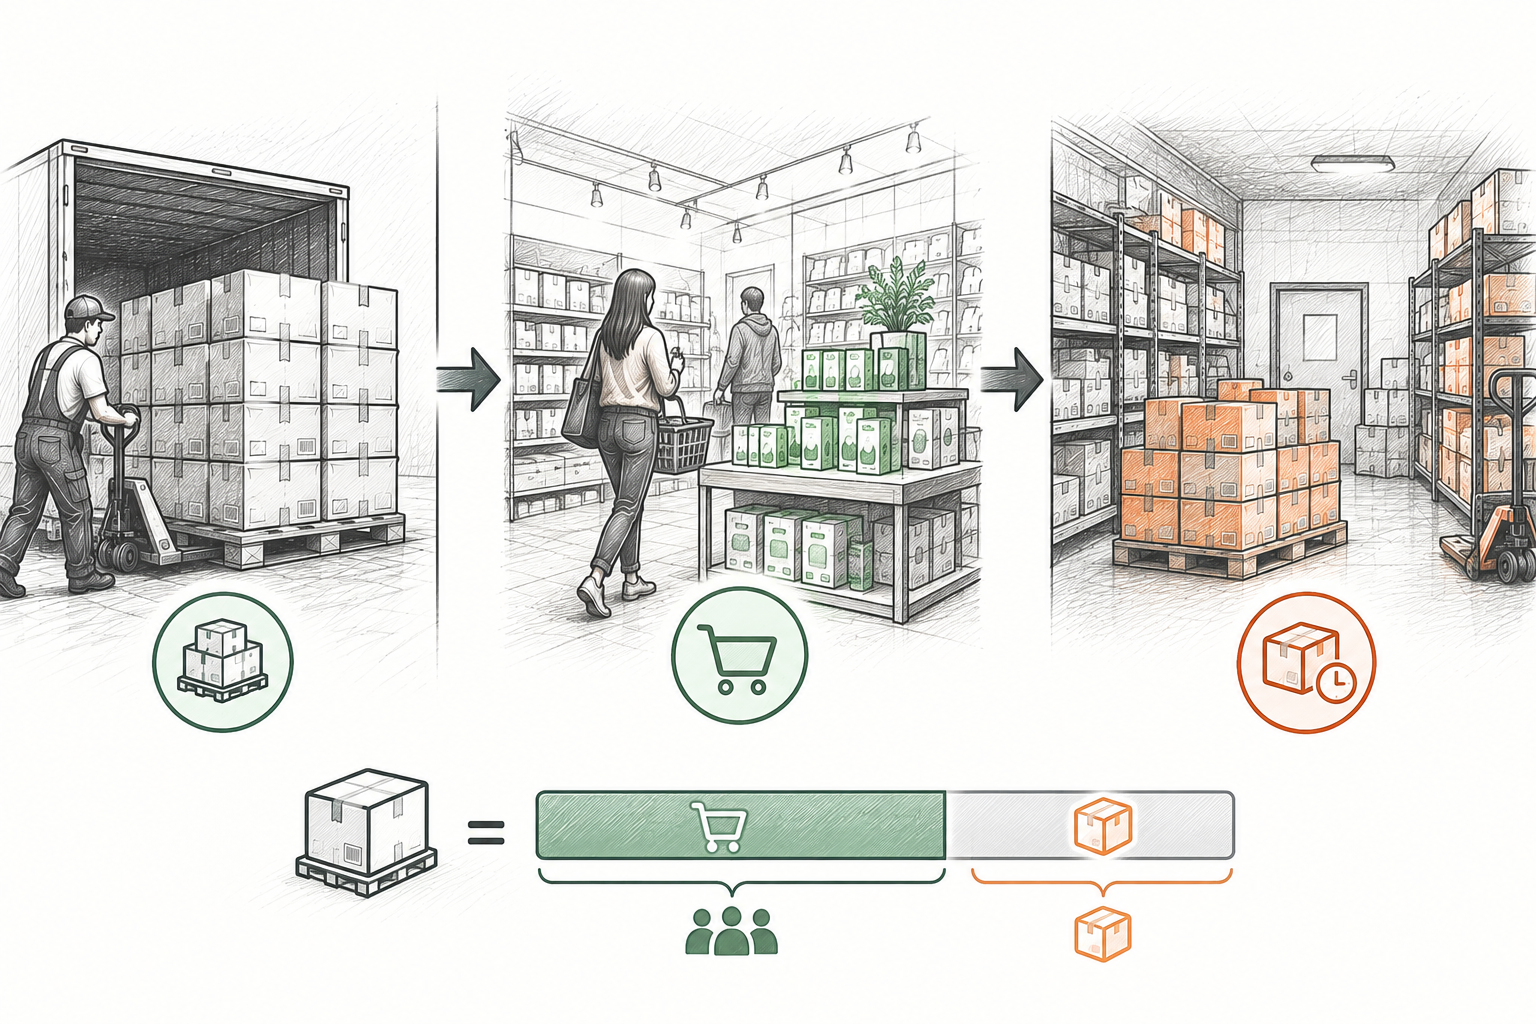
How to calculate inventory turnover (with worked retail example)
Inventory turnover evaluates overall capital efficiency by comparing the cost of merchandise sold against the average wholesale value of stock maintained on hand:
Cost of Goods Sold (COGS): Cost of Goods Sold (COGS): Over a 12-month fiscal period, an independent housewares retailer records $180,000 in wholesale product costs sold.
Beginning Inventory: Beginning Inventory at Cost: Value on January 1 stood at $35,000.
Ending Inventory: Ending Inventory at Cost: Value on December 31 stood at $45,000.
Average Inventory: Average Inventory at Cost: ($35,000 + $45,000) ÷ 2 = $40,000.
Calculated Turnover: Turnover calculation: $180,000 ÷ $40,000 = 4.5 turns per year.
Operational interpretation: The retailer turned and replaced its capital investment 4.5 times throughout the year, meaning average stock cleared every 81 days (365 ÷ 4.5).
Scenario analysis: where sell-through and turnover diverge
A frequent managerial mistake is assuming high sell-through automatically guarantees strong inventory turnover, or vice versa. In practical retail operations, these metrics frequently diverge:
High sell-through but low annual turnover
Sell-Through: Sell-Through: 85% in 4 weeks.
Turnover: Turnover Ratio: 2.1 turns annually.
Operational reality: A boutique ordered 100 units of a viral ceramic mug. Customers bought 85 units rapidly. However, the store owner waited 4 months to place another order, leaving display space underutilized and tying remaining store capital in other stagnant categories.
Action required: Establish automated reorder triggers and par levels to replenish high-velocity items promptly instead of allowing inventory momentum to collapse.
Low sell-through but high turnover ratio
Sell-Through: Sell-Through: 25% in 30 days.
Turnover: Turnover Ratio: 8.5 turns annually.
Operational reality: A convenience grocery stocks staple dairy products with a 2-day delivery cycle. Because the owner carries tiny safety buffers and orders twice weekly, the store completes turns rapidly even if an arbitrary 30-day cumulative cohort metric seems modest.
Action required: Rely on category turnover and stock-to-sales ratios rather than seasonal cohort sell-through for fast-moving consumable grocery lines.
Artificially high sell-through masking catastrophic margins
Sell-Through: Sell-Through: 92% in 14 days.
Turnover: Turnover Ratio: Distorted by panic markdowns.
Operational reality: Sluggish winter coats were slashed by 60% off wholesale during an unplanned flash clearance. While the units left the premises quickly, gross margin vanished and working capital was diminished.
Action required: Evaluate gross margin return on investment (GMROI) alongside sell-through to prevent clearance panic from destroying business equity.
Hidden stockouts driving artificially high sell-through
Sell-Through: Sell-Through: 100% in 5 days.
Turnover: Turnover Ratio: Sub-optimal due to empty shelves.
Operational reality: A specialty grocer bought 20 artisan chocolate bars that sold out instantly over a weekend. While sell-through was perfect, shelves sat empty for 25 days, missing out on hundreds of dollars in incremental revenue.
Action required: Increase initial order quantities or shorten vendor replenishment lead times to capture unfulfilled customer demand.
Why universal benchmarks do not exist for either metric
Retail business owners often ask: 'What is a good sell-through rate?' or 'What turnover ratio should I aim for?' Professional inventory managers know that universal benchmark numbers are dangerous myths:
Gross profit margin structure:
High-margin jewelry (60% to 75% gross margin) operates profitably on 1 to 2 inventory turns per year. Low-margin packaged groceries (15% to 22% margin) require 12 to 24 turns annually to cover store overhead.
Product shelf-life and perishability:
Fresh bakery items must sell through at 95%+ within 24 hours. Hardware tools, kitchenware, and greeting cards remain sellable for months without physical depreciation.
Supplier delivery lead times and MOQs:
Suppliers requiring large master-case orders force small stores to carry weeks of reserve inventory, inherently suppressing calculated turnover regardless of local popularity.
Seasonality and trend lifecycles:
Holiday decorations, swimwear, and dated calendar gifts have sharp liquidation deadlines requiring 80%+ sell-through before key dates, whereas staple year-round SKUs tolerate slower, steady movement.
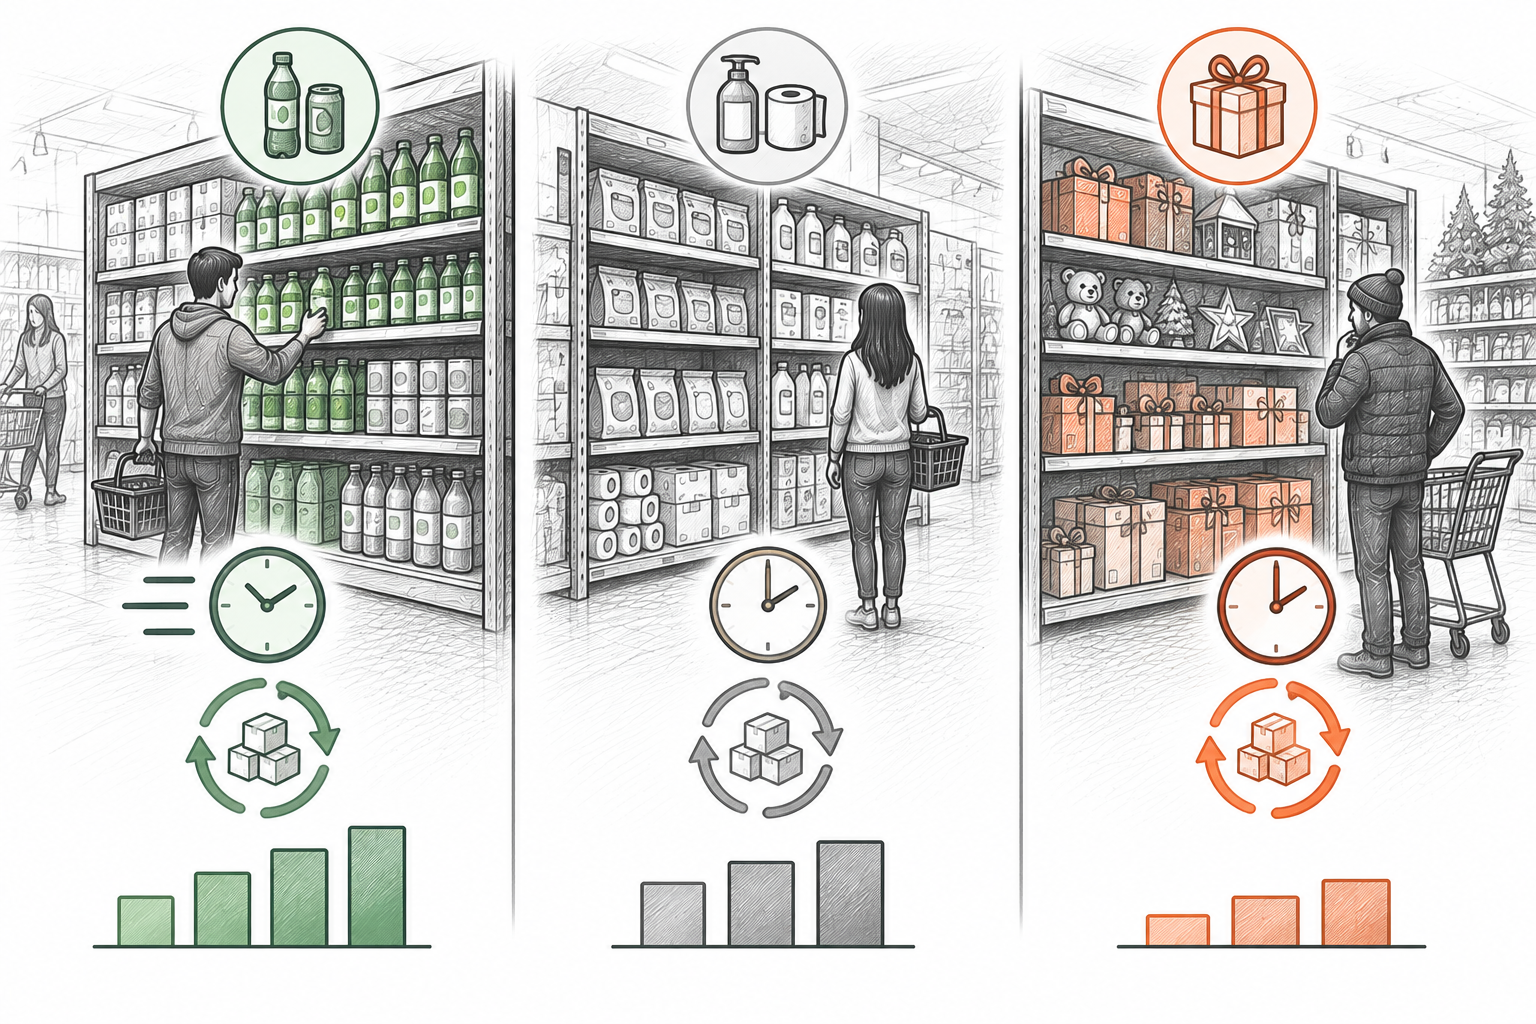
Decision matrix: when to use sell-through vs turnover
Knowing which metric to examine simplifies weekly merchandising and purchasing routines. Apply this operational decision matrix across standard store scenarios:
Evaluating a seasonal apparel, holiday decor, or limited-run promotional intake
Recommended Metric: Sell-Through Rate (Weekly cohort tracking)
You need immediate tactical visibility to decide whether to reorder bestsellers before distributor stock runs out or initiate early 15% to 20% markdowns before interest fades.
Assessing quarterly working capital health and overall merchandise borrowing costs
Recommended Metric: Inventory Turnover Ratio (COGS ÷ Average Inventory)
Turnover reveals whether your aggregate financial investment in stock is balanced relative to actual business revenue and cash obligations.
Managing staple, year-round consumable items with routine reorders
Recommended Metric: Inventory Turnover & Days Sales of Inventory (DSI)
Continuous deliveries blur cohort boundaries. Turnover and reorder points ensure steady replenishment without over-allocating backroom shelf space.
Diagnosing suspected dead stock and slow-moving products
Recommended Metric: Combined Analysis: Low Sell-Through Cohorts + Stagnant Category Turns
Cross-referencing both indicators isolates whether stagnation is confined to a specific supplier batch or reflects broader category saturation.
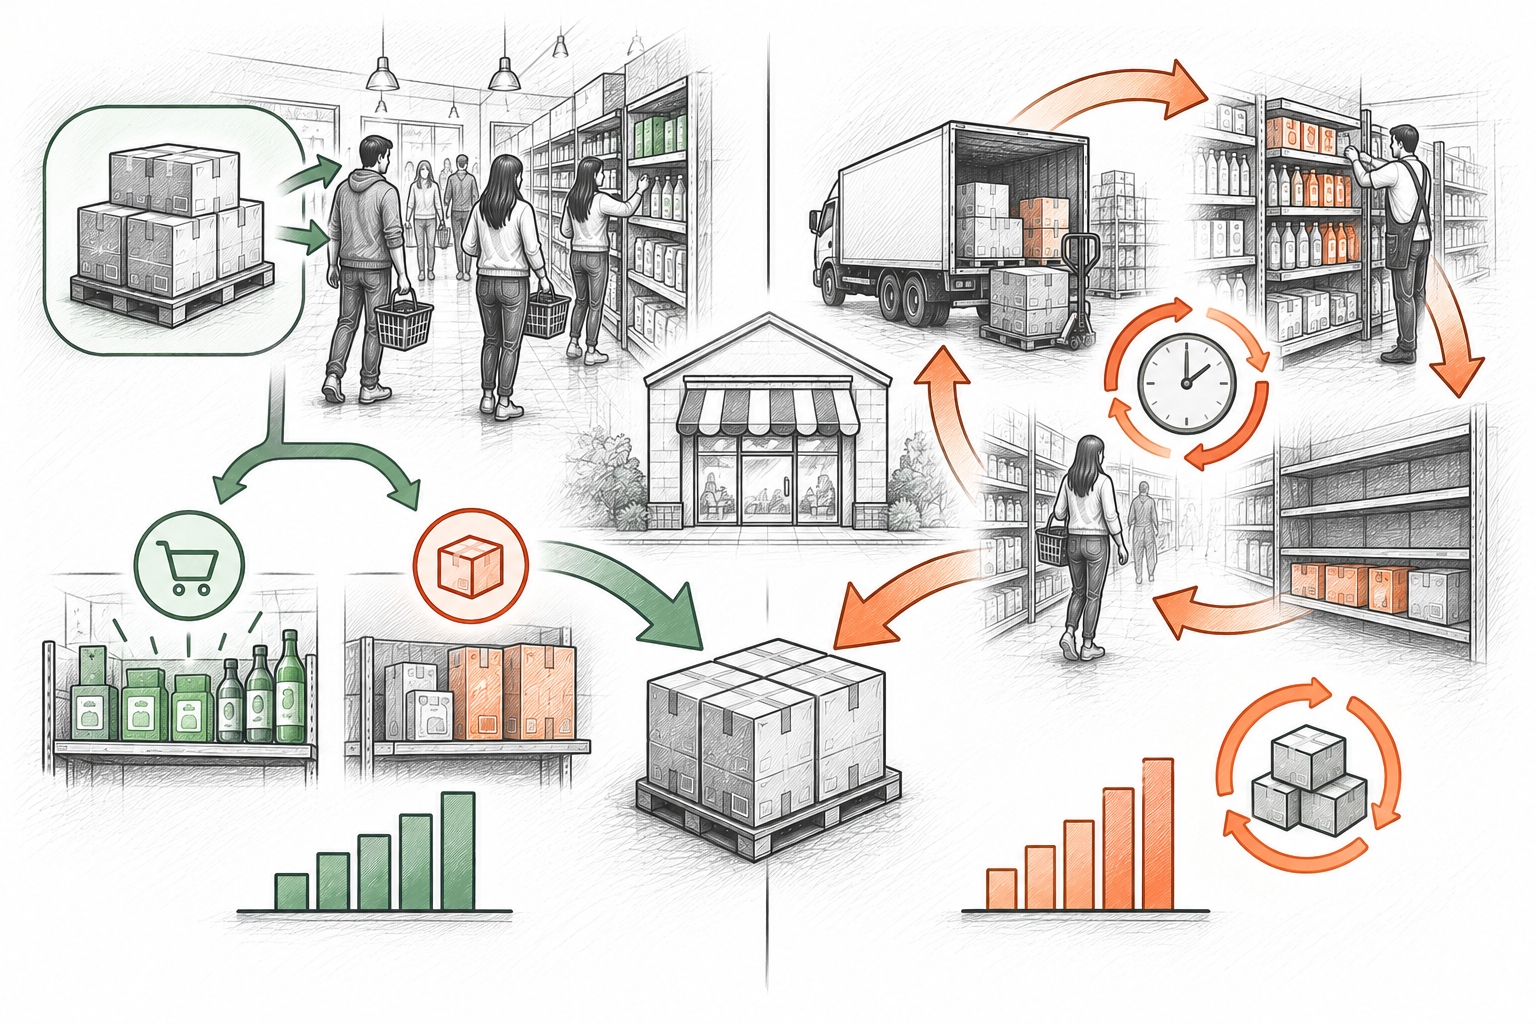
Data accuracy prerequisites: why counting and receiving matter
Neither sell-through rate nor inventory turnover ratio will provide reliable business intelligence if the underlying physical counts and receiving logs are flawed:
Disciplined intake receiving audits:
If vendor short-shipments or damaged cases are logged as received without inspection, your available stock denominator is inflated, distorting your calculated sell-through percentage.
Consistent physical count verification:
Unrecorded retail shrinkage, misplaced boxes, or unlogged breakages inflate recorded book inventory, depressing calculated inventory turnover and hiding cash leaks.
Accurate unit cost recording:
Financial turnover requires exact wholesale COGS figures. Blending retail prices with wholesale costs yields mathematically invalid results.
Standardized observation windows:
Tracking sell-through over erratic, shifting date spans produces misleading trends. Maintain consistent 7, 14, or 30-day review cadences.
How Retail Scan & Stock supports inventory velocity
Retail Scan & Stock provides the floor-level mobile tools independent merchants need to maintain rock-solid inventory data without enterprise complexity:
Mobile barcode auditing on iOS and Android:
Scan physical stock directly on sales displays and backroom shelves to verify accurate on-hand quantities before calculating metrics.
Receiving verification and shortage tracking:
Verify supplier deliveries against incoming packing slips to guarantee the intake figures in your sell-through denominator are exact.
Clean spreadsheet exports for accounting:
Export inventory valuations, stock quantities, and audit timestamps into clean CSV or Excel files for easy turnover analysis in your preferred spreadsheet.
Local-first floor reliability:
Perform counts smoothly in walk-in coolers, basements, or rural stockrooms without internet drops or connectivity delays.
Product boundary: Retail Scan & Stock's Free plan includes up to 1,000 SKUs, 5 open documents, 30-day history, 1 supplier, and 1 user on 1 device with offline storage, free forever; paid tiers add cloud synchronization. Retail Scan & Stock provides physical counting, receiving audits, and data exports; it does not automatically calculate financial metrics or perform automated algorithmic forecasting.
Frequently Asked Questions
Can a product have a 100% sell-through rate and still represent poor retail management?▾
Yes. A 100% sell-through rate achieved within a few days often indicates severe under-ordering or under-pricing. If 50 units sell out immediately and shelves remain empty for weeks, the store suffered lost revenue and disappointed shoppers.
Why does inventory turnover use Cost of Goods Sold rather than gross retail sales?▾
Retail sales include retail markup margins, whereas balance sheet inventory is recorded at wholesale acquisition cost. Comparing COGS to average inventory at cost creates a consistent like-for-like monetary ratio. Using retail sales artificially inflates turnover.
How do supplier minimum order quantities (MOQs) affect these metrics?▾
Large supplier MOQs force small retailers to buy excess volume. This initially depresses the sell-through percentage of that batch and slows store turnover by tying up working capital in reserve stock.
Should I calculate sell-through rate daily or weekly?▾
For fast-fashion, pop-up events, or promotional holiday launches, weekly sell-through tracking provides actionable guidance for timely markdowns. Daily tracking is generally noisy and unhelpful for small store operations.
How can I improve my store's inventory turnover without stocking out?▾
Order smaller quantities more frequently, negotiate split-case packs with vendors, prune chronic slow-moving SKUs, and use verified physical counts to prevent duplicate ordering.
Does Retail Scan & Stock calculate sell-through or turnover automatically?▾
No. Retail Scan & Stock focuses on accurate physical barcode counts, intake audits, and clean spreadsheet exports. You can paste your clean inventory data into spreadsheets or accounting software to compute financial metrics.
Related retail guides and tools