

Core financial insight
GMROI combines margin and inventory velocity into a single capital productivity metric. Neither high gross margin percentage nor rapid inventory turns alone guarantee a profitable inventory investment—it is the product of both working together that generates retail returns.
What GMROI means in plain language
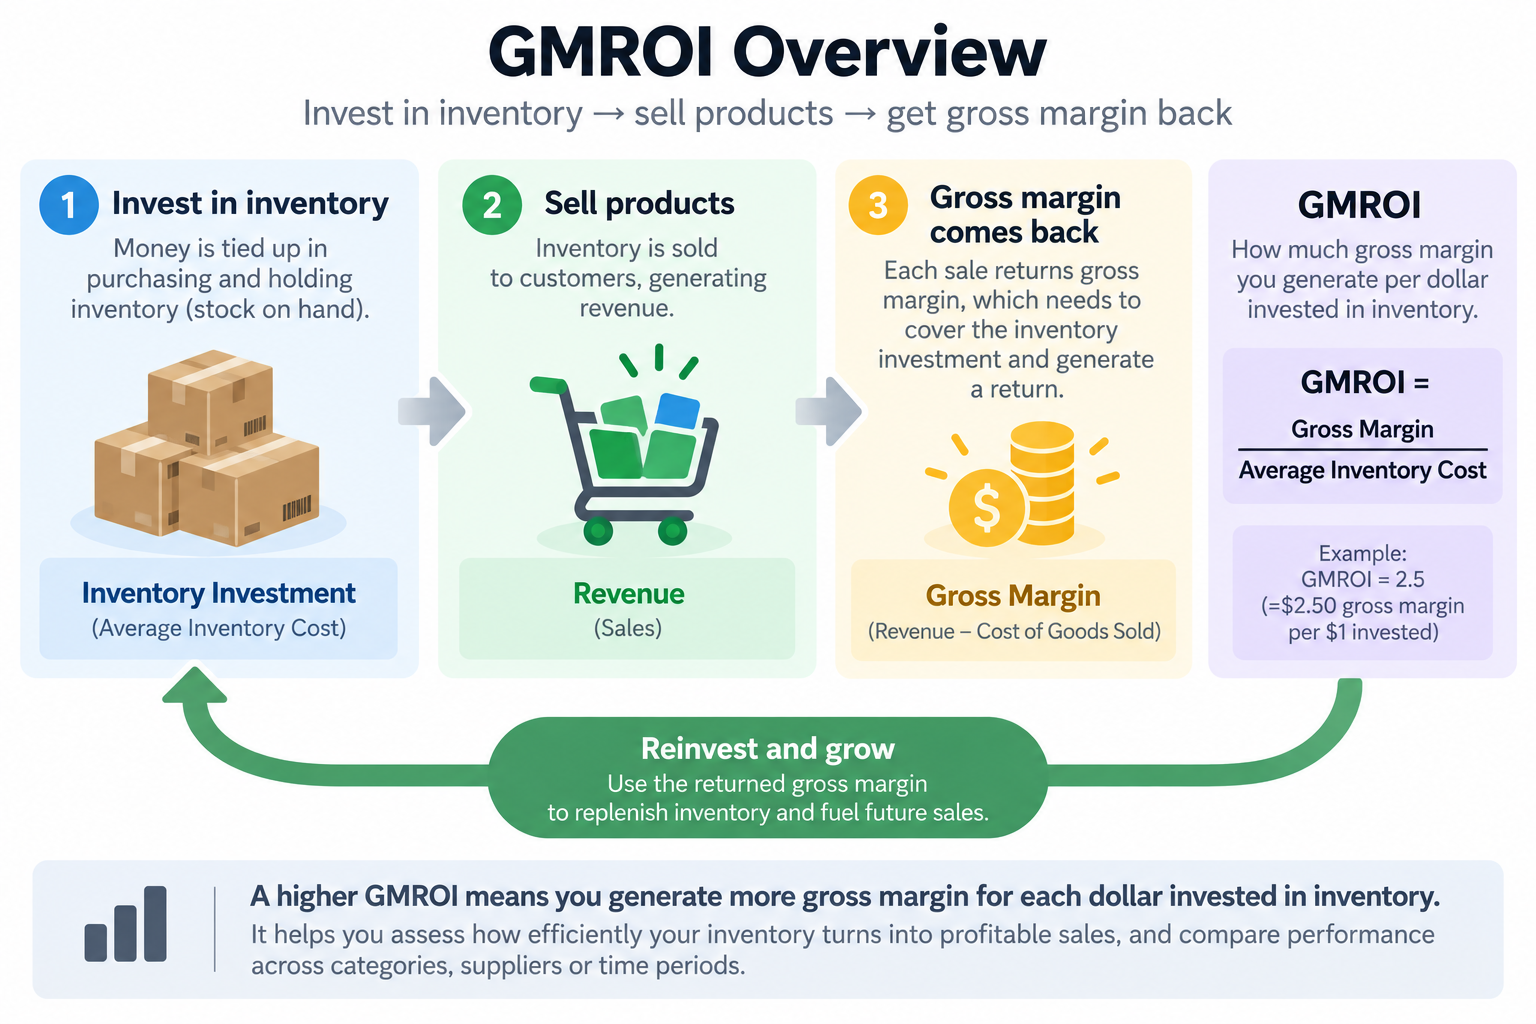
Gross Margin Return on Inventory Investment (GMROI) measures the financial productivity of the capital tied up in inventory. Rather than looking only at sales volume or percentage markups, GMROI shows how hard your inventory investment is working:
Return on capital locked in stock
Inventory represents committed working capital. GMROI measures how many dollars of gross profit margin you get back for every single dollar tied up in average inventory at cost.
A bridge between profit and velocity
Gross margin tells you what you make on an individual sale; inventory turnover tells you how fast goods move. GMROI brings them together into an overall return metric.
Category and supplier evaluation
Helps store owners objectively compare departments with wildly different margins and speeds, such as packaged groceries versus impulse giftware.
Why sales revenue alone can mislead independent retailers
Tracking top-line sales is natural, but high revenue numbers can hide severe inventory productivity problems:
High-volume items carrying heavy discount dilution
A category generating $50,000 in top-line sales may produce minimal gross margin dollars if continuous markdowns and promotional pricing destroy profitability.
Massive stock investment choking store cash flow
Generating $20,000 in gross margin sounds positive, but if doing so requires carrying $100,000 in average inventory on shelves, working capital is dangerously constrained.
The slow-moving high-markup illusion
Marking up an artisan item by 150% delivers impressive margin on a single ticket, but if stock only turns 0.5 times a year, the return on the dollars invested remains weak.
The standard GMROI formula and its accounting components
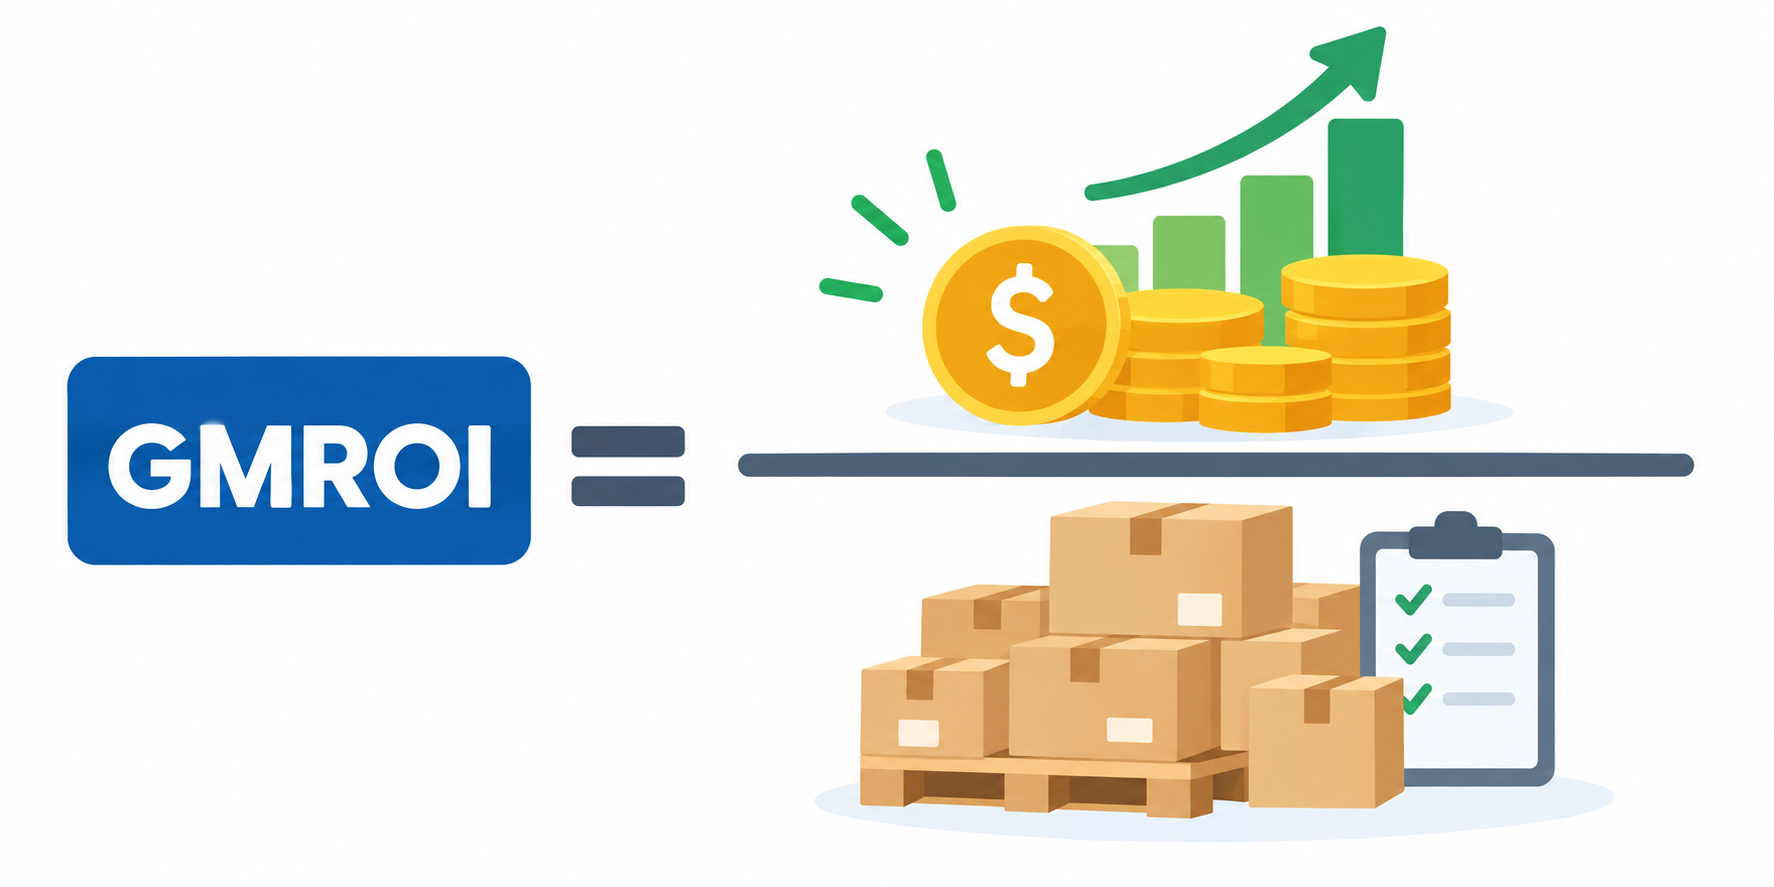
In operational retail accounting, GMROI compares gross margin dollars earned over a period against the average inventory carried at cost:
Gross Margin ($)
Net Sales − Cost of Goods Sold (COGS)
The total dollar amount of profit earned after subtracting the direct wholesale cost of sold merchandise from net sales revenue (after customer discounts and returns).
Average Inventory at Cost ($)
(Beginning Inventory at Cost + Ending Inventory at Cost) ÷ 2
The wholesale valuation of inventory held across the measurement window. Stores experiencing significant seasonal spikes should use monthly or quarterly snapshots to calculate a more representative average.
A simple worked calculation example for a small retail department
Let us walk through a concrete annual performance review for a boutique specialty gift department within an independent retail shop:
Annual Net Sales Revenue: $100,000
Cost of Goods Sold (COGS): $60,000
Gross Margin Generated: $100,000 − $60,000 = $40,000
Beginning Inventory at Cost (January 1): $14,000
Ending Inventory at Cost (December 31): $18,000
Average Inventory at Cost: ($14,000 + $18,000) ÷ 2 = $16,000
GMROI Calculation: $40,000 ÷ $16,000
Calculated GMROI: 2.5
In this worked example, a GMROI of 2.5 means the department generated approximately $2.50 of gross margin for every $1.00 of average inventory investment carried at cost across the year.
GMROI vs inventory turnover vs gross margin percentage
Store owners frequently confuse these three related retail metrics. Understanding how they interact is essential:
Gross Margin Percentage (GM %)
Pricing profitability per unit sold
(Gross Margin $ ÷ Net Sales $) × 100
Tells you how much profit each dollar of sales leaves behind, but completely ignores how long the inventory had to sit on the shelf before that sale happened.
Inventory Turnover Ratio
Merchandise velocity and turns
Cost of Goods Sold (COGS) ÷ Average Inventory at Cost
Shows how many times inventory was sold and replaced, but says nothing about whether those units were sold at a strong markup or cleared at breakeven.
GMROI (The Composite Metric)
Capital productivity of stock investment
Gross Margin $ ÷ Average Inventory at Cost
Combines margin and velocity (Turnover × Margin Multiplier), giving the total dollar return generated by the inventory investment.
Category comparison: high-margin slow-moving vs lower-margin fast-moving
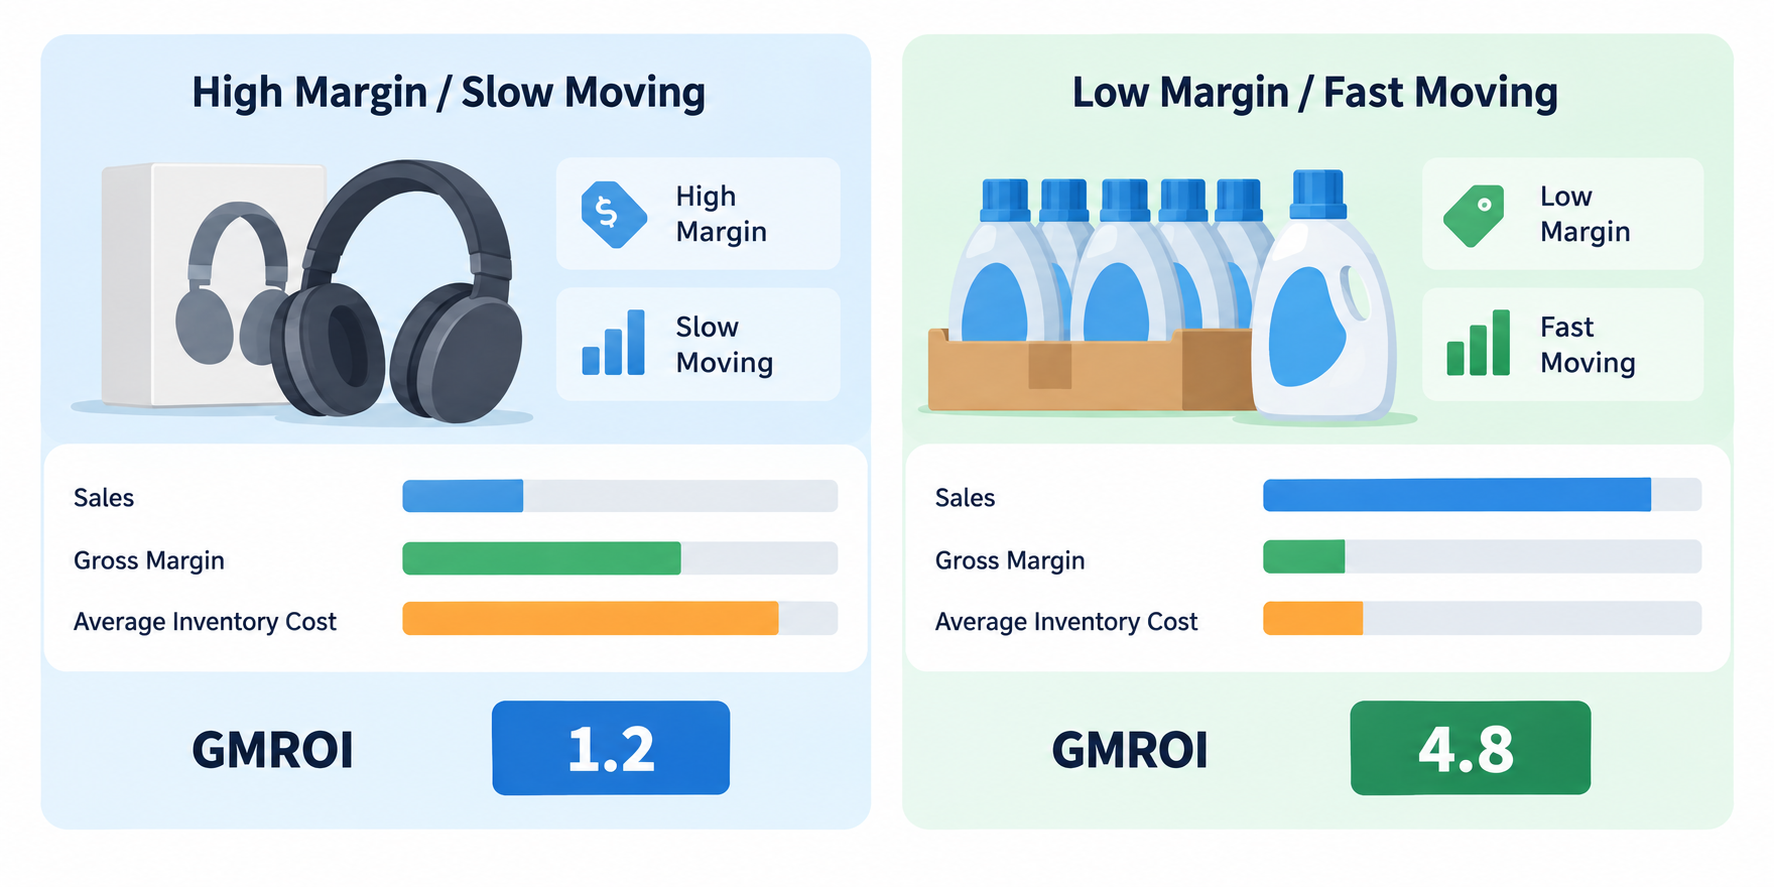
To see why margin percentage alone is deceptive, observe how two very different retail departments generate identical gross margin dollars from vastly different inventory investments:
| Retail Category | Gross Margin % | Annual Turns | Gross Margin ($) | Avg Inventory Cost ($) | Calculated GMROI | Operational Assessment |
|---|---|---|---|---|---|---|
| High-End Ceramic Tableware (Slow / High-Margin) | 60.0% | 1.0 turn / year | $30,000 | $20,000 | 1.50 | Generates $1.50 per dollar invested. Cash is locked up in display pieces for extended periods. |
| Specialty Roasted Coffee Beans (Fast / Modest-Margin) | 30.0% | 7.0 turns / year | $30,000 | $10,000 | 3.00 | Generates $3.00 per dollar invested. Lower margin is magnified by rapid stock velocity and frequent turns. |
Four practical ways a small retailer can improve GMROI
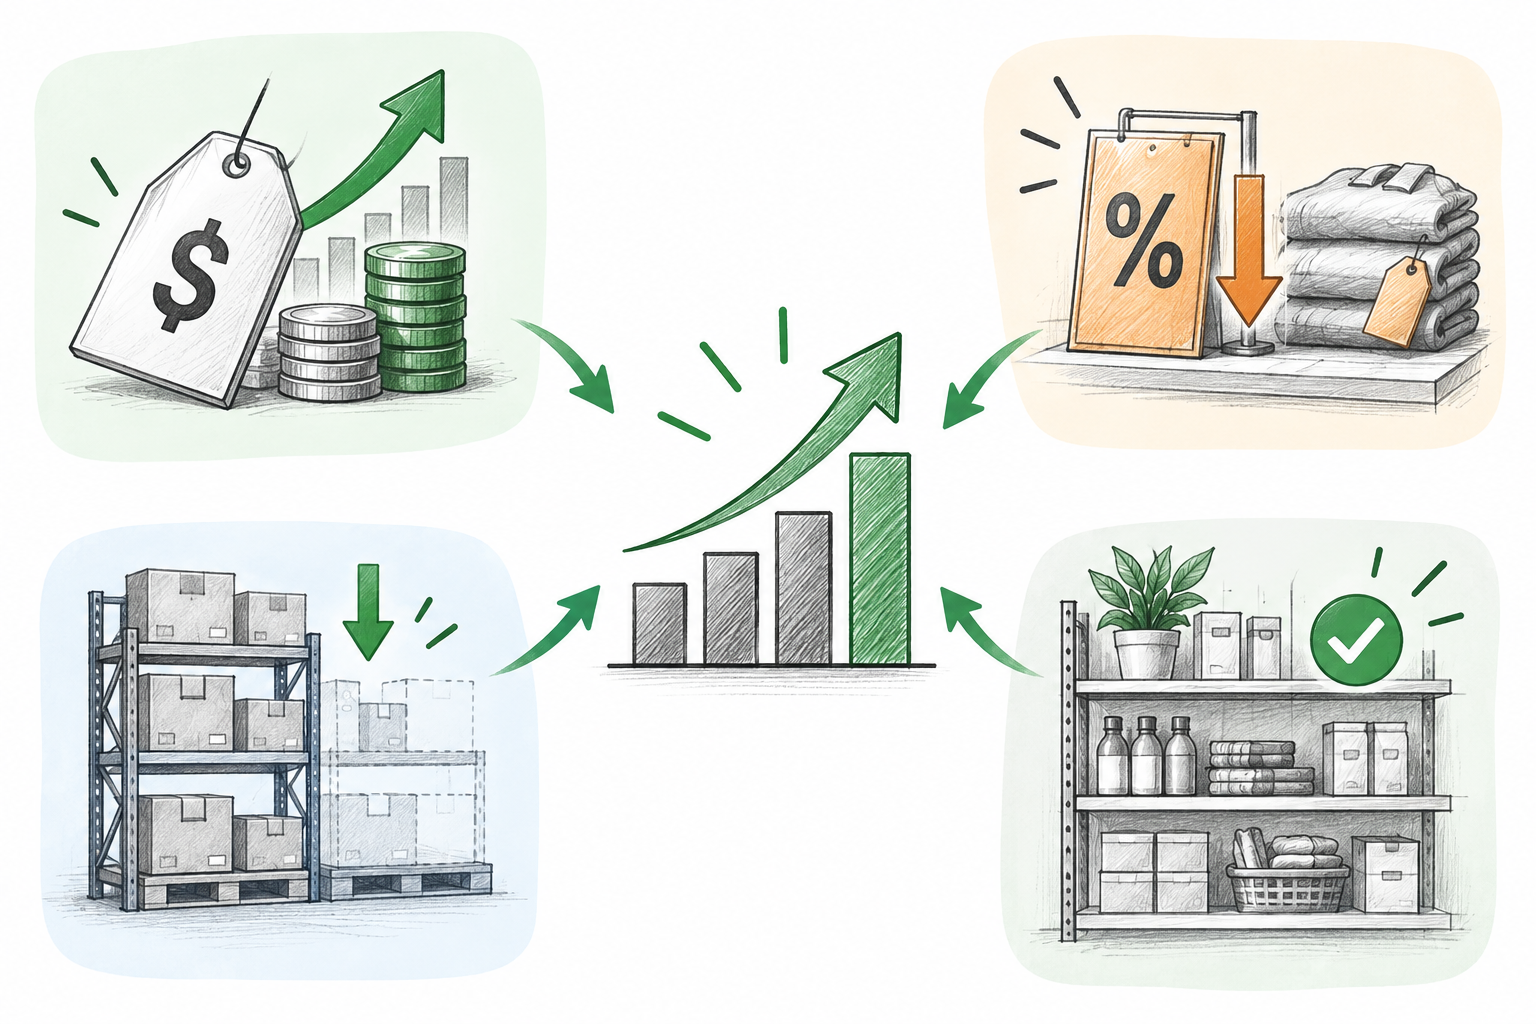
Because GMROI is a function of gross margin and inventory investment, retailers have four operational levers to lift their ratio:
1. Protect and improve realized gross margins
Review vendor pricing tiers, negotiate better wholesale terms, eliminate loss-making lines, and apply strategic price adjustments to price-insensitive specialty SKUs.
2. Reduce unnecessary and reactive markdowns
Order smaller batches aligned with current sales velocity. When goods do not pile up in the backroom, you avoid panic clearance sales that erode margin dollars.
3. Lower average inventory investment
Establish disciplined reorder points, embrace lean replenishment, and avoid buying massive bulk batches solely to achieve minor invoice discounts.
4. Rationalize and upgrade the product assortment
Identify unproductive slow-moving items that tie up disproportionate shelf capital, and reallocate that budget toward proven fast-moving winners.
Practical use by category, vendor, and season (and its limits)
Applying GMROI across your entire store produces a broad general average, but the metric delivers its greatest value when applied at granular levels:
Calculate GMROI by category and supplier, not just store-wide
Store-wide GMROI masks winners and losers. Evaluating individual vendors reveals which distributor relationships deliver true margin productivity.
Account for seasonal peaks and inventory buildups
Measuring a holiday category right after seasonal pre-orders arrive skews average inventory upward. Use twelve-month rolling averages for seasonal stock.
GMROI does not account for operating overhead expenses
GMROI stops at gross margin. It does not factor in high refrigeration electricity, delicate handling labor, or credit card processing fees required by specific products.
Where Retail Scan & Stock fits in the inventory workflow
Accurate GMROI calculation requires reliable inventory valuation data. Retail Scan & Stock provides the foundational physical counting tools:
Accurate physical inventory counts
Scan shelves with your smartphone camera to ensure recorded stock balances match physical reality, preventing distorted average inventory valuations.
Structured supplier purchase orders
Draft purchase orders directly from counted shortages, keeping ordering quantities aligned with actual sales velocity.
Clean spreadsheet exports (CSV & Excel)
Export stock valuations and receiving history to calculate GMROI by category or vendor in your preferred spreadsheet program.
Frequently Asked Questions
What is considered a good GMROI for an independent retail store?
There is no universal good GMROI across retail sectors. Because capital intensity, markup percentages, and turnover speeds differ fundamentally by merchandise type, stores should compare performance against like-for-like categories or track the same department over time. A higher GMROI is generally preferable only when calculated using consistent accounting periods and inventory valuation methods.
Can GMROI be calculated for an individual product SKU?
Yes, provided you track the product's individual net sales, cost of goods sold, and average inventory value. SKU-level GMROI is particularly useful for identifying whether high-value display merchandise justifies the upfront capital required to keep it on the shelf.
How does GMROI differ from ROI (Return on Investment)?
ROI is an enterprise-wide financial metric that compares net profit (after rent, salaries, marketing, taxes, and overhead) to total business investment. GMROI is a merchandising productivity metric that compares gross margin to inventory investment alone.
Why should I use cost inventory instead of retail selling price in the denominator?
GMROI measures the return on the cash money you actually invested in inventory. Your wholesale purchase cost represents the actual dollars tied up on shelves. Using retail selling price understates the true productivity of your capital.
How often should a small retail store calculate and review GMROI?
Calculating GMROI on a quarterly or annual basis provides stable, actionable insight into category health. Monthly calculations are helpful for fast-turning seasonal categories to detect margin decay or overstocking early.
Related inventory guides and resources
- Inventory Turnover Ratio: A Simple Guide for Small Retail Stores →
- Sell-Through Rate vs Inventory Turnover: What Small Retailers Should Track →
- Inventory Carrying Cost: What Unsold Stock Really Costs a Small Retailer →
- Dead Stock vs Slow-Moving Inventory: How Small Retailers Can Spot and Fix Both →
- ABC Inventory Analysis: How Small Retailers Can Prioritize Their Stock →