

Core operational principle
ABC classification is an operational prioritization tool, not an absolute financial law. While Pareto's 80/20 principle provides a helpful mental model, exact revenue percentages vary across categories, and factors like gross margin, supplier lead time, and customer expectations require human judgment.
What ABC inventory analysis means in plain language
ABC inventory analysis is a method of categorizing products based on their economic contribution to your store. Rather than trying to monitor hundreds or thousands of SKUs with equal vigilance, retailers separate inventory into three operational tiers:
Class A: High-priority core merchandise
The relatively compact group of items that drives the vast majority of sales volume and store cash flow.
Tightest stock control, frequent counts, protected shelf space, and close supplier coordination to prevent costly stockouts.
Class B: Moderate-priority middle assortment
Steady, reliable secondary sellers that maintain steady consumer interest with intermediate sales velocity.
Routine periodic monitoring, standard reorder triggers, and regular replenishment reviews without daily intervention.
Class C: Lower-priority long tail
The large number of slow-moving varieties, accessories, or niche sizes that contribute only a minor slice of revenue.
Simplified bulk ordering, relaxed count intervals, and ongoing vigilance against excess accumulation or dead stock.

Why treating every SKU equally wastes precious management attention
Small independent retailers work under strict constraints of time and frontline staff. When a store attempts to count, audit, and reorder all products on identical rigid cycles, three major operational breakdowns occur:
Diluted focus on critical revenue drivers
Time spent auditing slow-turning bulk spices or novelty greeting cards leaves staff unavailable to catch empty shelves on high-velocity milk, coffee, or specialty snacks.
Premature cash depletion from untargeted reorders
Ordering replenishment inventory across all items uniformly ties up precious working capital in Class C goods while Class A winners run short.
Stocktaking fatigue and scanning errors
Exhausting frontline workers with massive full-store counts dilutes counting accuracy where precision matters most.
How to rank products by revenue contribution and cumulative share
The classic starting point for an ABC classification is ranking your assortment by historical revenue over a defined observation window (such as the prior 90 or 180 days). Here is the straightforward sequence:
Step 1: Extract sales revenue per SKU
Multiply the units sold for each product by its retail selling price across your selected tracking timeframe.
Step 2: Sort SKUs from highest to lowest revenue
Rank the product list in descending order, placing your top revenue generator at the very top.
Step 3: Calculate individual and cumulative percentage share
Divide each product's revenue by total store revenue to find its percentage share, then calculate running cumulative totals down the column.
Step 4: Group products into preliminary A, B, and C tiers
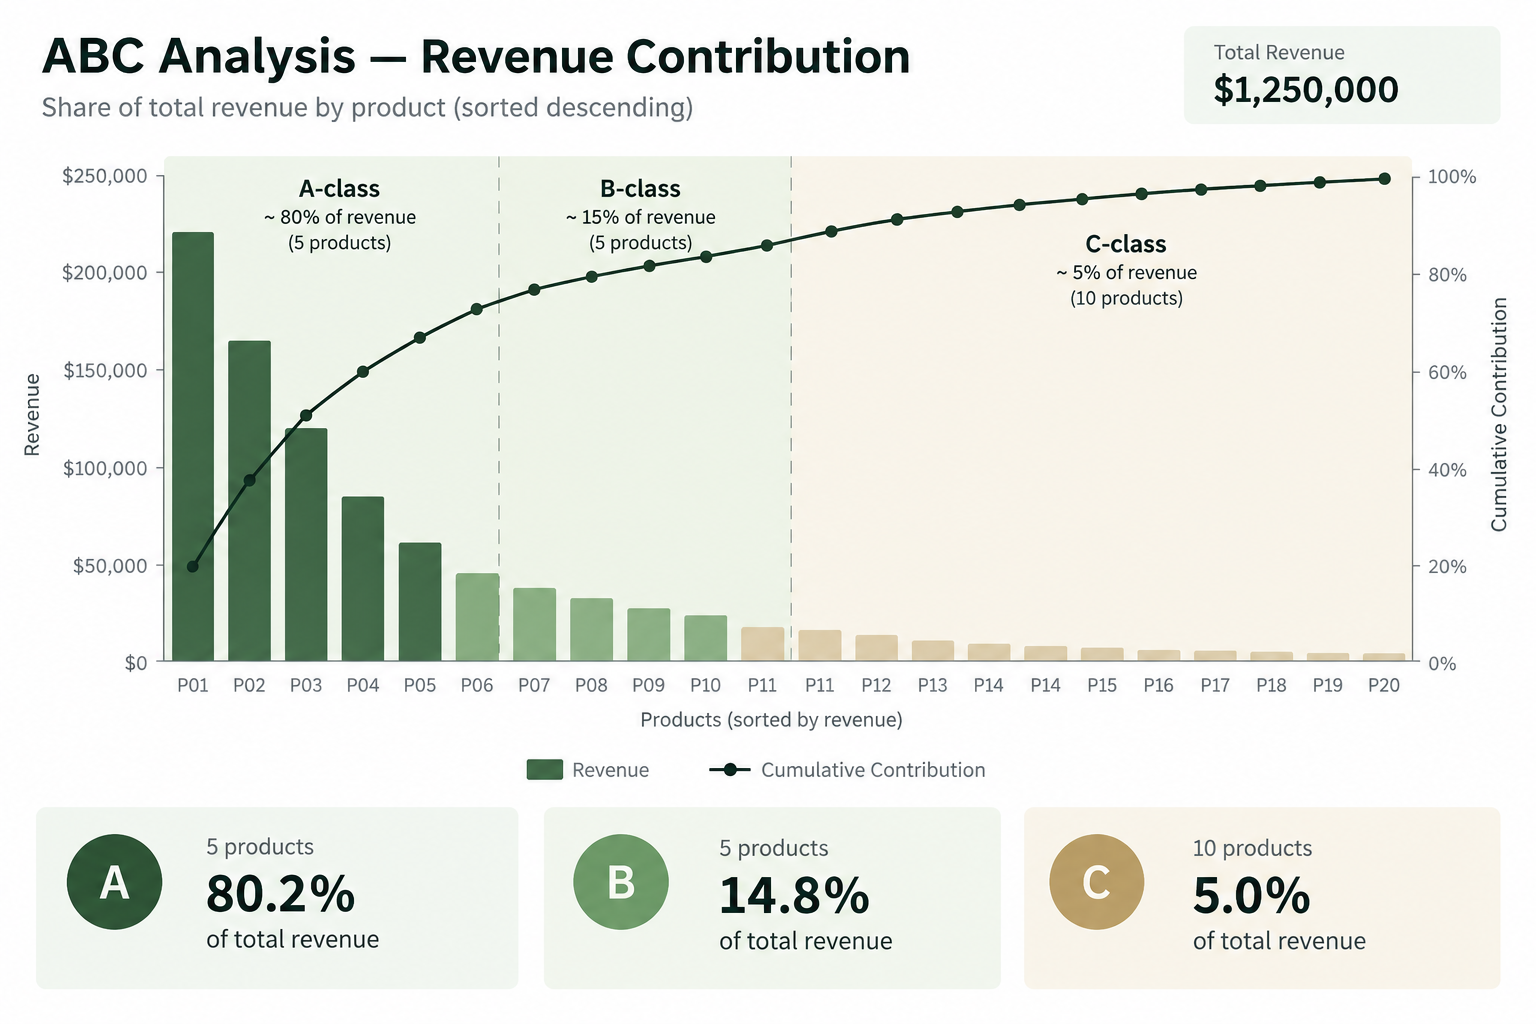
As an illustrative starting example (rather than a rigid universal rule), designate the top band contributing roughly 70% to 80% of revenue as Class A, the next band contributing roughly 15% as Class B, and the long tail contributing roughly 5% as Class C. Adjust these thresholds based on your store's specific assortment and margin profile.
A simple worked retail ABC classification example
Consider a neighborhood boutique market evaluating ten representative SKUs from its specialty beverages and pantry department over a trading period with $10,000 in total sales revenue:
| SKU | Product Description | Period Revenue | Revenue Share | Cumulative Share | ABC Class |
|---|---|---|---|---|---|
| BEV-0101 | Single-Origin Whole Bean Coffee 1kg | $4,800 | 48.0% | 48.0% | Class A |
| BEV-0102 | Artisan Ceremonial Matcha 100g | $2,400 | 24.0% | 72.0% | Class A |
| PAN-0201 | Organic Cold-Pressed Olive Oil 750ml | $1,100 | 11.0% | 83.0% | Class B |
| BEV-0103 | Loose Leaf Earl Grey Black Tea 250g | $600 | 6.0% | 89.0% | Class B |
| PAN-0202 | Aged Balsamic Vinegar of Modena 250ml | $400 | 4.0% | 93.0% | Class C |
| PAN-0203 | Raw Wildflower Honey Jar 500g | $250 | 2.5% | 95.5% | Class C |
| SNK-0301 | Gourmet Roasted Sea Salt Almonds 200g | $200 | 2.0% | 97.5% | Class C |
| PAN-0204 | Flaky Smoked Sea Salt Finishing Tin 125g | $120 | 1.2% | 98.7% | Class C |
| BEV-0104 | Organic Herbal Chamomile Flowers 50g | $80 | 0.8% | 99.5% | Class C |
| ACC-0401 | Unbleached Cotton Tea Infuser Bag Pack | $50 | 0.5% | 100.0% | Class C |
In this illustrative sample, the top 2 products (20% of SKUs) account for 72.0% of department sales. The next 2 items deliver 17.0%, bringing cumulative revenue to 89.0%. The remaining 6 items represent 60% of product variety but yield only 11.0% of cash flow.
How ABC classification shapes practical stock-counting schedules
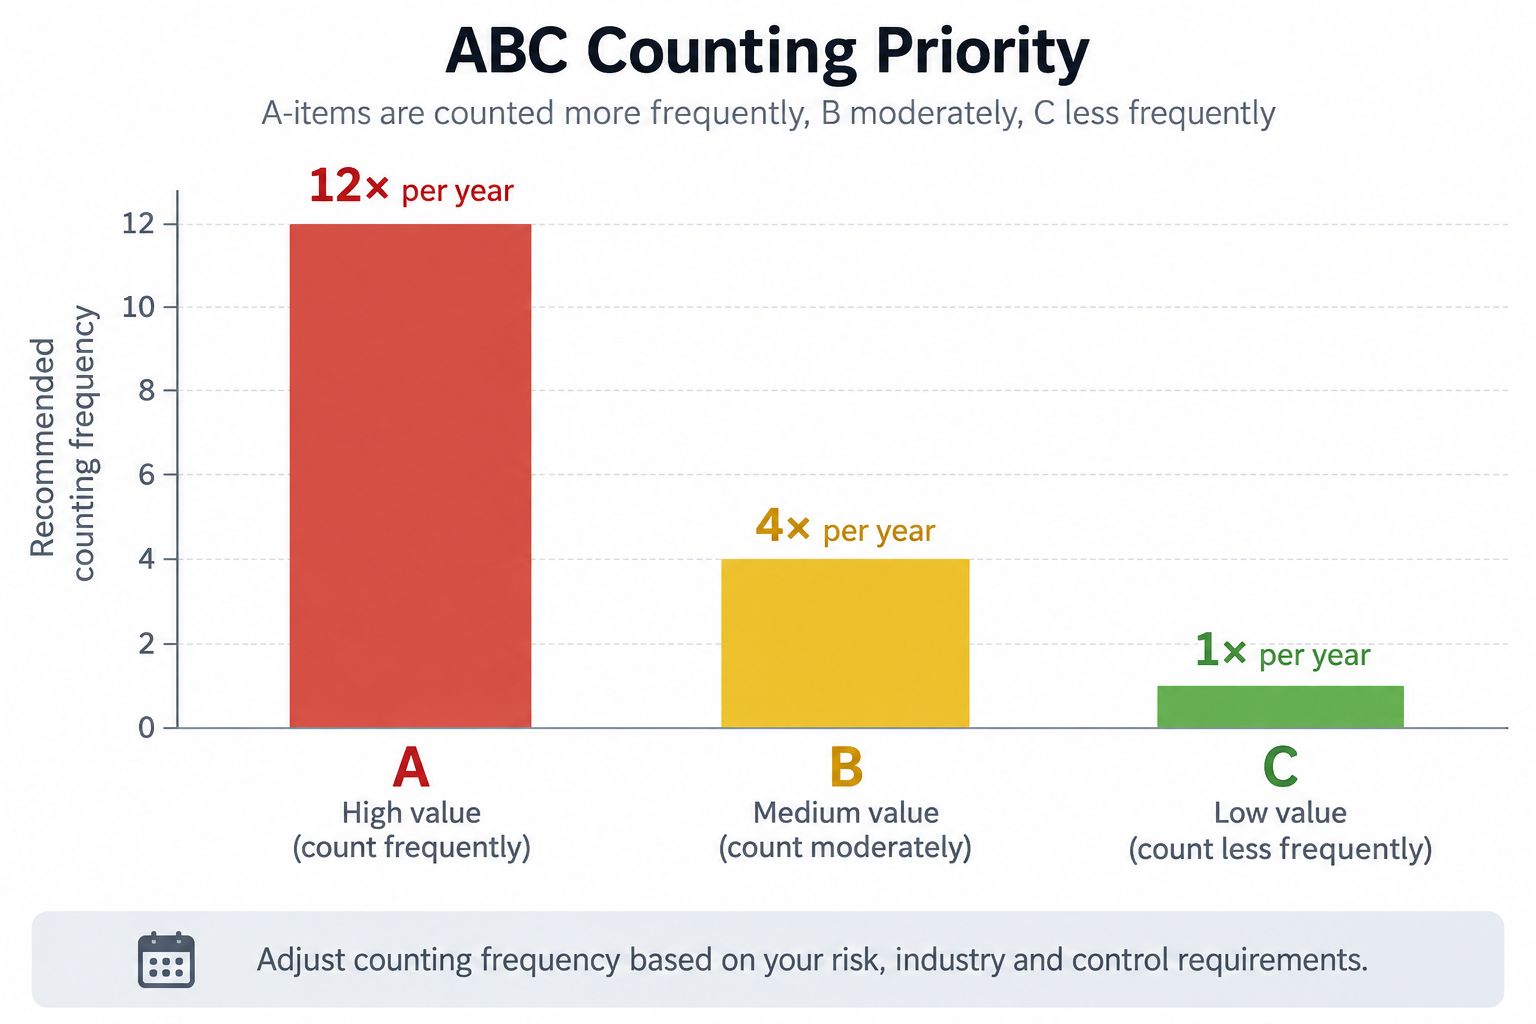
One of the most immediate operational benefits of ABC analysis is designing a manageable cycle-counting routine. Counting every item weekly is impractical, but counting everything only once a year permits massive unrecorded shrinkage. An illustrative prioritized counting schedule provides balance:
Class A Stock (Illustrative Frequency)
Weekly or bi-weekly cycle verification
High-velocity sales increase the chance of unrecorded checkout skips or physical misplaced stock. Frequent verification ensures on-hand numbers are fresh before reorders.
Class B Stock (Illustrative Frequency)
Monthly rotation
Moderate turnover means inventory variances accumulate at a manageable pace. Monthly checks catch creeping record drift without overwhelming staff.
Class C Stock (Illustrative Frequency)
Quarterly, bi-annually, or full audit
Slow velocity means physical counts rarely change week-to-week. Auditing these too frequently wastes labor that could protect critical cash flow.
How ABC analysis guides replenishment attention and supplier reviews
ABC grouping transforms how retail managers approach purchasing and supplier negotiations:
Replenishment attention for Class A
Dynamic safety stock and tight reorder thresholds
Collaborate closely with distributors on lead times, establish backup supplier sources, and track supplier fulfillment accuracy rigorously.
Replenishment attention for Class B
Standard reorder points and routine order schedules
Group orders to meet standard minimums and consolidate deliveries with regular weekly or monthly supplier runs.
Replenishment attention for Class C
Batch ordering or rationalized assortment
Order in bulk case packs only when necessary, resist high vendor minimums for slow movers, and evaluate whether non-performing items can be phased out.
Important limitations of revenue-only ranking and why 80/20 is not a law
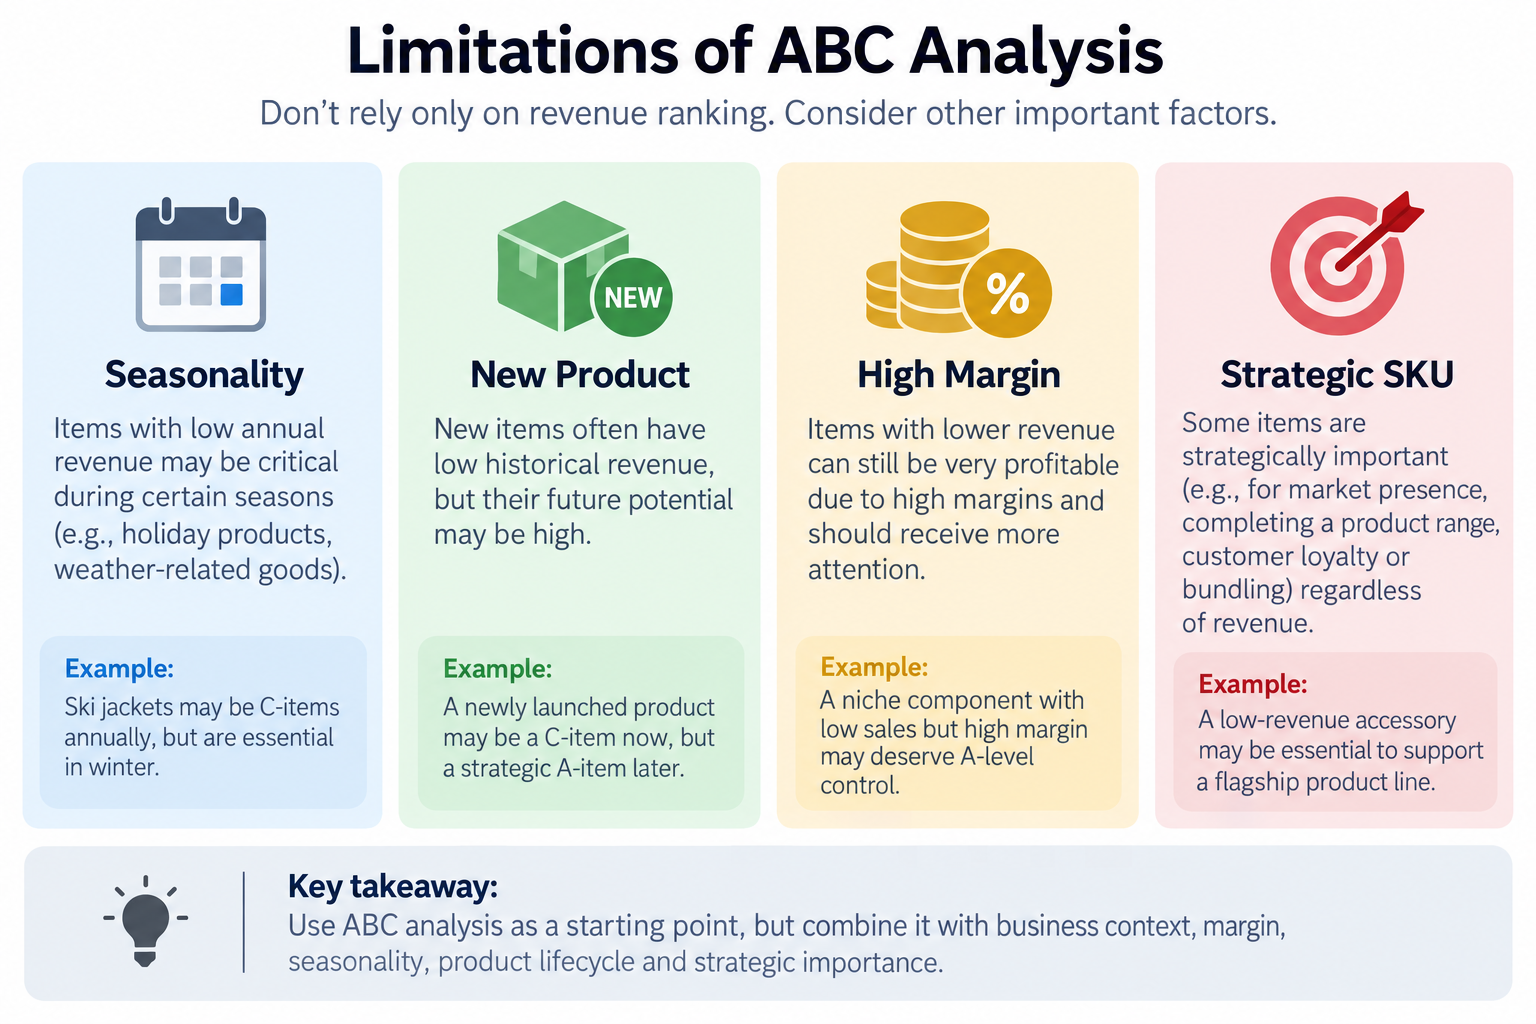
Treating revenue ranking as an unquestioned business verdict leads to severe merchandising mistakes. Small retailers must balance mechanical rankings with practical retail reality:
Seasonality and holiday spikes
A summer sunblock or winter holiday gift set looks like a dead Class C product during off-peak quarters if measured over the wrong timeframe.
Segment historical rankings by selling season or review products against trailing 12-month rolling data before downgrading items.
New products without sales history
Newly introduced merchandise starts with zero sales volume and will naturally sit at the bottom of a revenue table.
Place new product introductions in an observation incubation tier for 60 to 90 days before assigning permanent ABC categories.
High-margin specialty items
A luxury fountain pen, fine perfume, or specialty tool might generate modest gross revenue but contribute 60% gross profit margin.
Consider ranking by gross profit contribution rather than top-line revenue, or manually elevate high-margin items to Class B.
Strategic, complementary, and must-stock SKUs
Specialty repair needles, replacement gaskets, or boutique flavor syrups may sell rarely but make the sale of main products possible.
Protect core assortment items that anchor customer loyalty, even if revenue contribution remains in the bottom percentile.
Practical ABC review workflow for an independent retail store
Rather than attempting continuous algorithmic reshuffling, adopt a periodic, disciplined workflow that fits routine retail operations:
Establish an observation timeframe
Use quarterly or semi-annual review windows to prevent temporary weekly promotions from distorting baseline categories.
Rank by value and review edge cases
Sort sales reports by revenue or gross margin, identify preliminary A, B, and C tiers, and manually adjust for seasonal and new SKUs.
Assign physical counting zones and tags
Designate shelf fixtures or product groups in your count sheets so staff know which items require weekly cycle verification.
Align purchasing rules with supplier minimums
Ensure Class A items have clear reorder triggers, while Class C orders are scrutinized against carrying costs and storage constraints.
Where Retail Scan & Stock fits in the inventory workflow
Accurate ABC prioritization relies on knowing what you physically have on the shelf. Retail Scan & Stock provides the foundational counting and document workflow:
Mobile barcode cycle counting
Scan Class A fixtures rapidly using your smartphone camera during business hours without dragging heavy terminals or paper clipboards.
Supplier-organized purchase orders
Turn verified stock shortages into structured supplier purchase orders directly on your phone as soon as high-priority items cross reorder thresholds.
Clean spreadsheet exports (CSV & Excel)
Export counting sessions and stock balances to Excel or CSV to calculate revenue contribution and rank your catalog in your preferred spreadsheet tools.
Frequently Asked Questions
Are Class A items always exactly 20% of catalog products and 80% of revenue?
No. The 80/20 rule is an empirical rule of thumb, not a universal mathematical constant. In many grocery or convenience stores, Class A might represent 12% of SKUs generating 65% of revenue, or 25% of SKUs generating 85%. Stores should use sensible cutoffs based on natural inflection points in their cumulative contribution curve.
Should I classify products based on revenue, units sold, or gross margin?
Revenue is the most common starting point because it correlates closely with customer demand and cash volume. However, margin-based ABC analysis is superior if you carry high-volume loss leaders alongside high-margin specialty goods. Some retailers use composite criteria (e.g. margin dollars and velocity) for high-value items.
How often should a small retail store review and update ABC classes?
Reviewing ABC classes once every quarter or twice a year is a practical starting cadence for many independent stores, but the right schedule depends on seasonality, catalog churn, and promotional cycles. Reviewing too frequently creates confusion and unstable counting schedules, while reviewing only once a year risks missing emerging trends and shifting customer habits.
What should I do with Class C products that barely sell?
First determine whether the product is a necessary complementary item (e.g. specialized batteries or spare parts) or a customer-service staple. If it has no strategic purpose and ties up working capital, allow stock to sell through without reordering, or discount it to liberate cash.
Can I perform an ABC analysis using a simple spreadsheet?
Yes. Export your sales and inventory records to CSV or Excel, sort rows by sales revenue or gross margin descending, calculate individual percentage shares, and compute cumulative percentages. You can then mark each row as Class A, B, or C based on your chosen cutoff thresholds.
Related inventory guides and resources
- How Often Should a Small Store Count Inventory? →
- Cycle Counting vs Physical Inventory: Small Retail Guide →
- Inventory Turnover Ratio: A Simple Guide for Small Retail Stores →
- Dead Stock vs Slow-Moving Inventory: How Small Retailers Can Spot and Fix Both →
- Inventory Carrying Cost: What Unsold Stock Really Costs a Small Retailer →