

Critical Retail Rule
Never rely on arbitrary industry figures like "holding costs are always 20–30%". Your actual carrying cost depends directly on your facility lease, financing rates, insurance terms, product perishability, and local jurisdiction.
What Inventory Carrying Cost Really Means
Carrying cost (also referred to as holding cost) represents the cumulative expense of storing unsold merchandise over a given period, typically an entire fiscal year. While retailers readily recognize the initial wholesale price of products, the cash quietly draining away on stockroom shelves is often underestimated.
Carrying cost is not a one-time transaction fee but an ongoing operational cost proportional to time and volume.
Tying up capital in slow inventory directly constrains cash flow needed for marketing, payroll, and seasonal winners.
Every day an item sits on the shelf, it absorbs storage overhead, incurs insurance allocation, and faces depreciation risk.
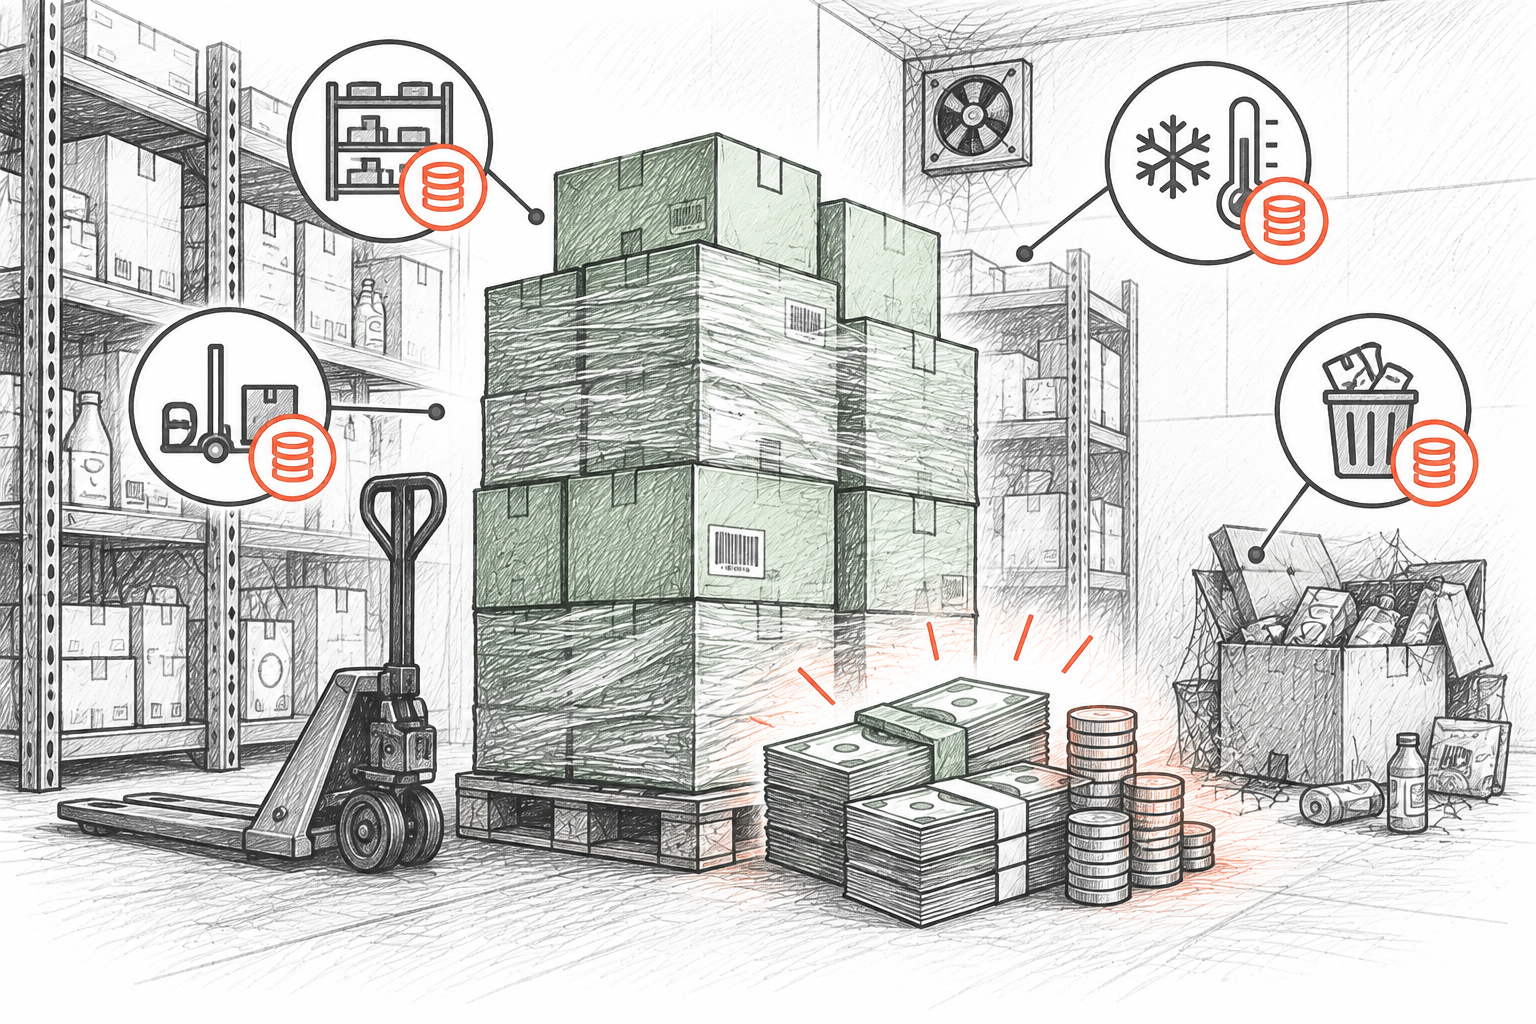
Safe General Expression and Calculation Formula
Because capital costs, local commercial lease structures, and product vulnerabilities vary dramatically between a rural hardware shop and an urban boutique, no universal holding percentage exists. Instead, use a safe, store-specific calculation model.
Worked Example: Specialty Hardware Retailer
Average Inventory: $60,000 average inventory value across 12 months
Holding Rate: Sum of annual storage, financing, handling, insurance, and shrink: $13,200 (Rate = 22%)
Calculation: $60,000 × 0.22
Result: $13,200 annual carrying cost
Holding an extra $10,000 in slow-moving stock for an entire year costs this merchant an estimated $2,200 in carrying expenses alone.
The Four Core Cost Components
Retail inventory holding costs fall into four recognized operational pillars. Isolating each bucket prevents unexpected cash drain.
Capital Cost (Financing & Opportunity)
The cost of money invested in inventory rather than interest-bearing deposits, debt paydown, or marketing.
- Revolving credit line interest
- Supplier financing charges
- Opportunity cost of locked working capital
Storage Space Cost
Direct and proportional real estate costs required to house, secure, and climate-control your goods.
- Square footage rent allocation
- Backroom shelving and fixtures
- Utilities (lighting, HVAC, power)
Inventory Service Cost
Administrative, regulatory, and financial protections associated with maintaining legal custody of goods.
- Inventory insurance policies
- Applicable local property or inventory taxes
- Physical cycle-counting labor
Inventory Risk Cost
Value erosion occurring while products sit waiting for a buyer.
- Internal and external shrinkage (theft/loss)
- Product expiration and obsolescence
- Damage from handling and shelf wear
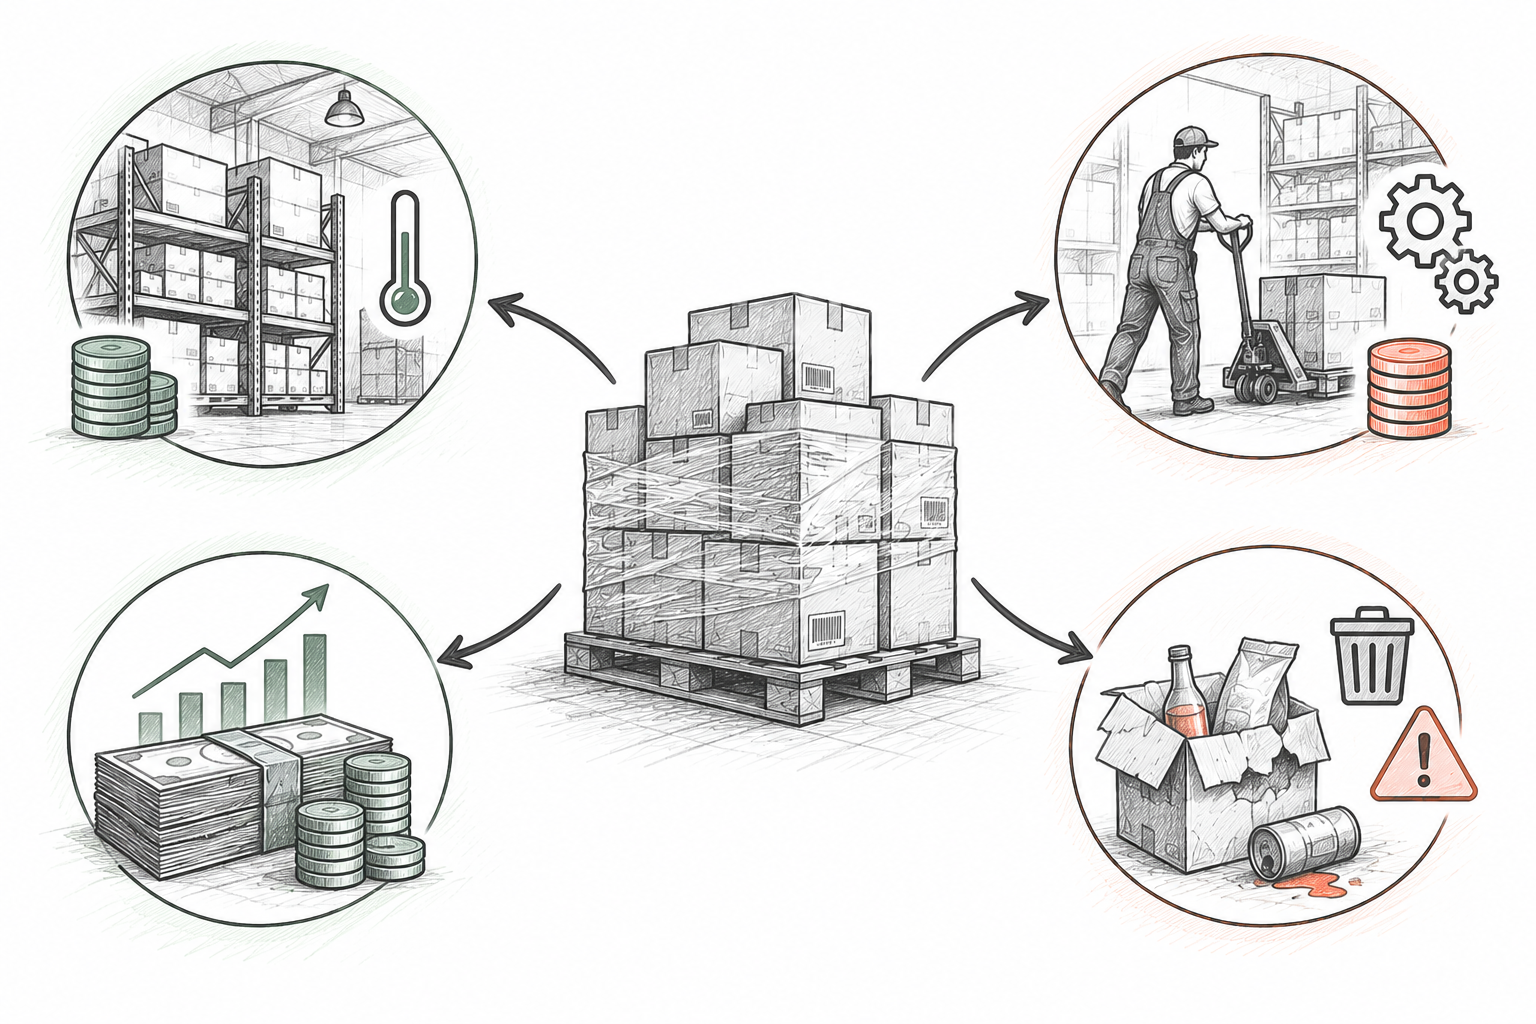
Deep Dive into Cost Component Breakdown
Understanding how each cost element behaves allows retailers to accurately measure their store-specific holding rate.
Financing & Working Capital
If inventory purchases are funded via commercial bank loans or credit lines, actual interest rates apply directly. If funded with retained profits, the benchmark reflects the expected return on alternative investments.
Fluctuates with macro interest rates, creditworthiness, and supplier payment terms.
Warehousing & Store Footprint
Allocating retail lease expense across front-of-house sales floor vs. back-of-house inventory storage clarifies true square-foot holding expense.
Urban high-street leases carry far higher holding costs per square meter than suburban or industrial locations.
Insurance & Jurisdiction Taxes
Commercial inventory insurance premiums depend on merchandise risk profiles and replacement value. In some jurisdictions, inventory taxes apply to static stock levels at fiscal year-end.
Not all stores pay inventory taxes; insurance coverage requirements vary widely by region and category.
Shrinkage, Damage & Obsolescence
Unrecorded physical loss, accidental handling breakage, packaging tears, and style obsolescence permanently wipe out asset value over time.
Fresh foods and trend-driven apparel experience steep risk curves, whereas industrial fasteners carry minimal obsolescence.
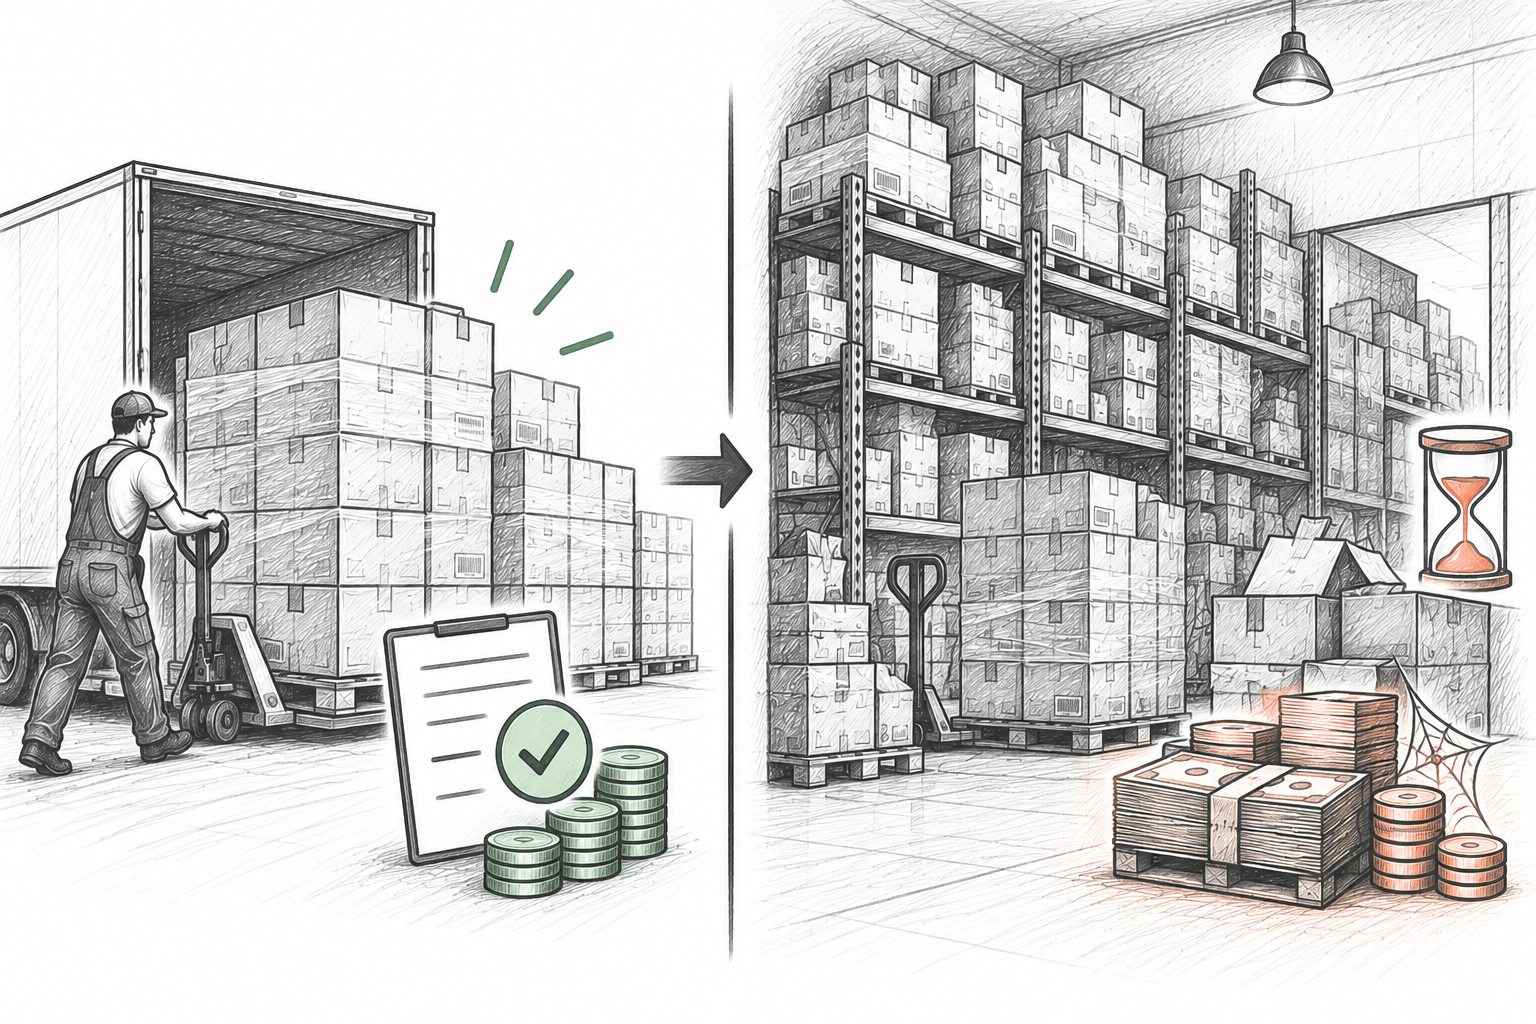
Healthy vs Excess vs Dead Stock
Not all aged inventory is identical. Treating every slow-moving item as unsellable scrap damages margins, while ignoring mounting stockroom congestion burns working capital.
Healthy Moving Inventory
Stock actively turning according to forecasted sales velocity and lead times.
Carrying cost: Baseline holding cost is absorbed smoothly by planned gross margin margins.
Action: Maintain established replenishment triggers and monitor safety stock levels.
Excess Stock
Inventory quantities exceeding 60–90 days of forward demand due to over-ordering or sales dips.
Carrying cost: Gradually escalates holding costs, occupies prime backroom space, and restricts cash flow.
Action: Slow reorders, bundle with fast sellers, or offer targeted promotional markdowns.
Dead Stock
Unsold items that have generated zero sales transactions over an extended cycle (e.g., 180+ days) with negligible remaining demand.
Carrying cost: 100% carrying cost waste; asset value steadily decreases toward zero.
Action: Liquidate, clearance sell, return to vendor if permitted, or donate for tax deductions.
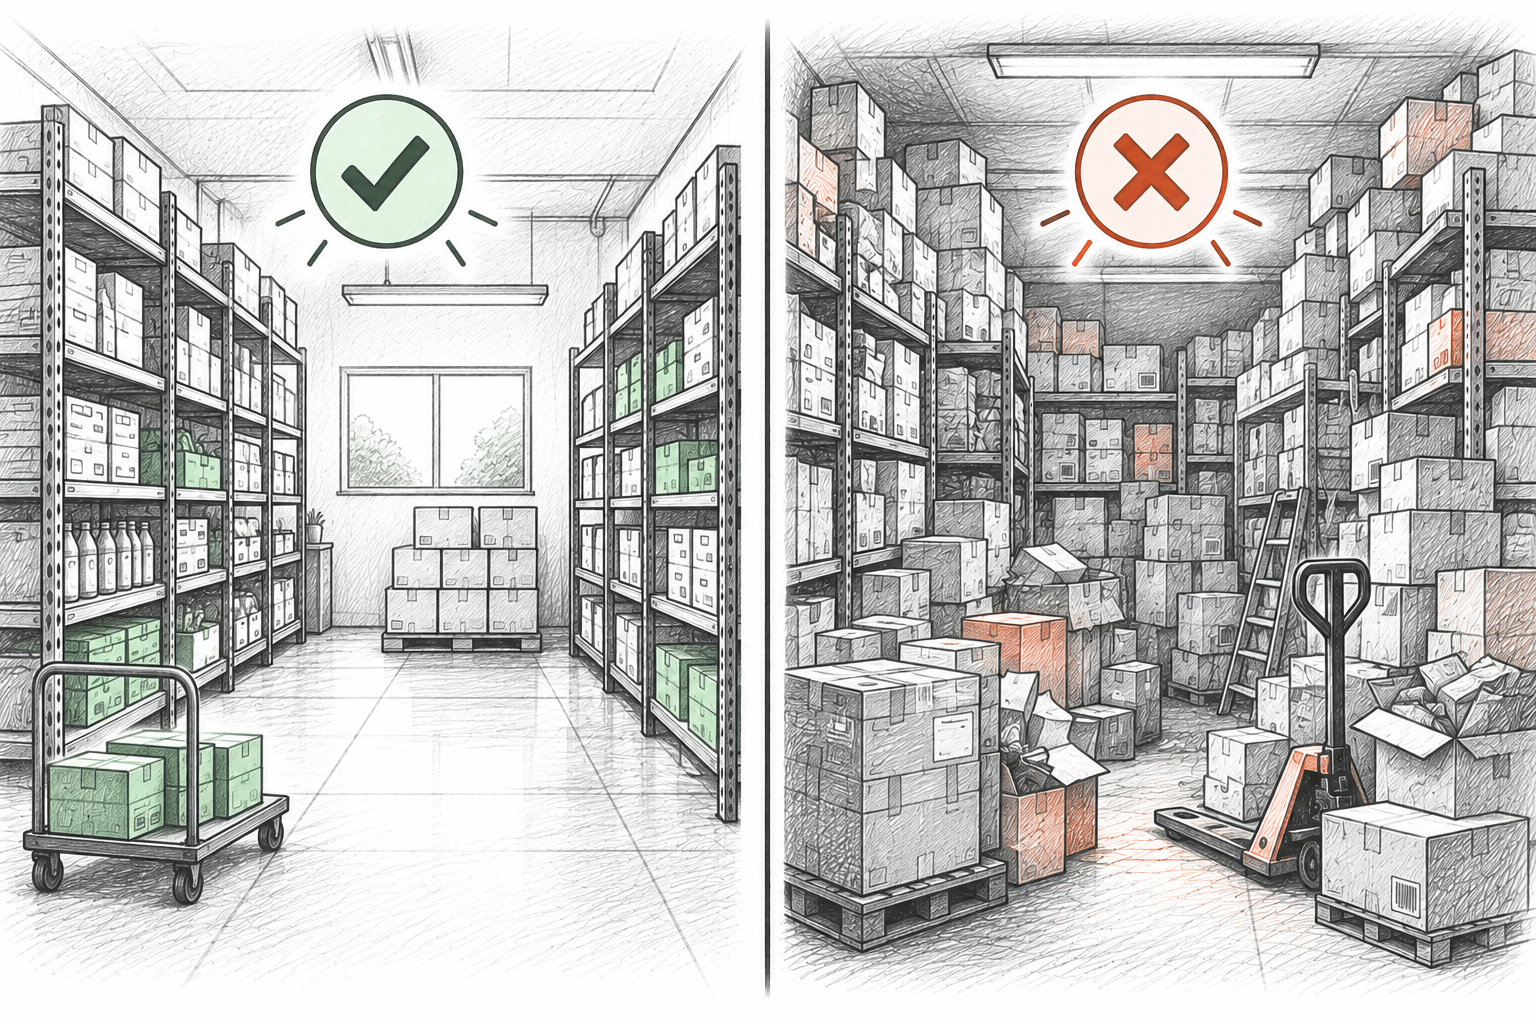
Practical Strategies to Lower Carrying Costs
Lowering carrying costs does not require complex enterprise software. Disciplined stockroom habits and lean ordering protocols create immediate operational relief.
Conduct Frequent Cycle Counts
Perform rolling barcode counts on focused categories rather than halting store operations for annual inventory. Fast detection of discrepancies prevents phantom inventory and unnecessary reorders.
Re-evaluate Supplier Order Quantities
Order smaller batches aligned with current run-rates rather than chasing maximum tier discounts on untested or slower items.
Establish Defined Reorder Points
Calculate reorder points and buffer levels based on realistic vendor lead times to avoid over-buffering backroom reserves.
Systematically Clear Stagnant SKUs
Establish an ongoing markdown cadence for merchandise showing zero turns after 60 days before products become unsellable dead stock.
Audit Backroom Space Utilization
Organize stockrooms with clear bin labels and barcode tags to reduce labor handling hours, misplacement, and handling damage.
Where Retail Scan & Stock Fits (Product Boundary)
Retail Scan & Stock provides small merchants with fast, camera-based barcode scanning and stock-counting workflows directly on mobile devices.
On-Device Cycle Counting & Stock Audits
Scan physical inventory rapidly using your smartphone camera to maintain accurate stock counts across store shelves and backrooms.
Purchase Order & Inbound Receiving Verification
Verify inbound supplier deliveries directly against ordered items to prevent supplier under-deliveries or surplus stock additions.
Export Clean Stock Data for Analysis
Export inventory lists and transaction histories via CSV to perform holding cost calculations in your preferred spreadsheet tools.
Product Boundary: Retail Scan & Stock offers a Free Forever plan supporting up to 1,000 SKUs, 5 documents, 30 days of history, 1 supplier, and 1 device without cloud sync. Paid tiers add cloud synchronization across multiple team devices. Retail Scan & Stock is a streamlined inventory scanning and counting tool; it does not automatically calculate carrying cost percentages or provide automated financial accounting ledgers.
Frequently Asked Questions
What is a normal inventory carrying cost rate for a small retail shop?▾
There is no single universal percentage. Depending on financing structure, retail rent rates, utility bills, insurance costs, and product perishability, typical annual holding rates can range from 15% to over 35% of inventory value. Each business must calculate its own specific rate.
Does buying in bulk always save money for small retailers?▾
No. While bulk purchases lower the per-unit invoice cost, the extra stock ties up cash and incurs storage, insurance, and risk costs. If products sit in the backroom for months, the accumulated holding costs can easily exceed the original bulk discount.
How does carrying cost differ from cost of goods sold (COGS)?▾
COGS is the direct wholesale cost of acquiring the products you sell. Carrying cost represents the ongoing operational expenses required to store, insure, finance, and safeguard unsold inventory while it waits on your shelves.
Can inventory scanning tools automatically calculate carrying costs?▾
No. Scanning and counting apps track physical quantities, barcode lookups, and stock movements. Calculating carrying costs requires combining your inventory valuation with external business expenses like store rent, financing interest, insurance, and utility bills.
What is the fastest way for a small retailer to reduce carrying costs?▾
Focus on ordering discipline: stop over-ordering slow-moving items, negotiate smaller replenishment batch sizes with suppliers, run regular cycle counts, and immediately discount stagnant stock to liberate tied-up cash.
Related Retail Inventory Guides
- → Inventory Turnover Ratio for Small Retail: Benchmarks and Formula
- → Dead Stock vs Slow-Moving Inventory: Identification and Recovery
- → Reorder Point vs Par Level vs Safety Stock: Practical Guide
- → Inventory Shrinkage for Small Retail: Prevention and Detection
- → From Stock Count to Purchase Order: Streamlined Workflow